


Network Analyzer Performance Specification Summary G
Installation and User’s Guide 143
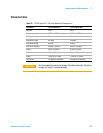
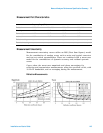
Measurement Port Characteristics
Measurement Uncertainty
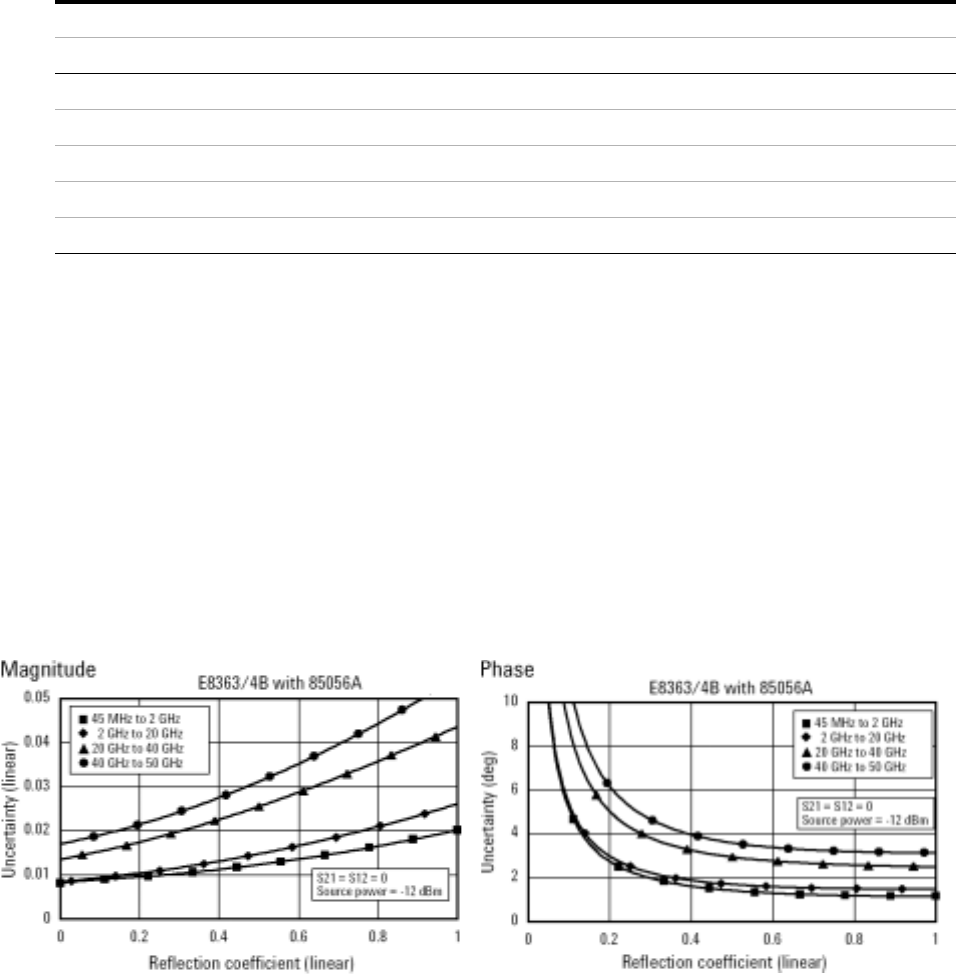
Measurement uncertainty curves utilize an RSS (Root Sum Square) model
for the contribution of random errors such as noise and typical connector
and test set switch repeatabilities. These are combined with a worst- case
model for the contributions of dynamic accuracy and residual systemic
errors.
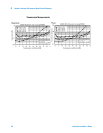
Curves show the worst- case magnitude and phase uncertainty for
reflection and transmission measurements, using the specified cal kit, with
10 Hz IF bandwidth, and no averaging during the measurement.
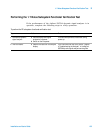
Reflection Measurements
Frequency Range (GHz)
Residual 0.045 to 2.0 2.0 to 20.0 20.0 to 40.0 40.0 to 50.0
Directivity 42 dB 42 dB 38 dB 36 dB
Source match 41 dB 38 dB 33 dB 31 dB
Load match 42 dB 42 dB 37 dB 35 dB
Reflection tracking
±(0.001 + 0.2 dB/°C) ±(0.008 + 0.2 dB/°C) ±(0.020 + 0.3 dB/°C) ±(0.027 + 0.4 dB/°C)
Transmission tracking
±(0.019 + 0.2 dB/°C) ±(0.053 + 0.2 dB/°C) ±(0.114 + 0.3 dB/°C) ±(0.215 + 0.4 dB/°C)