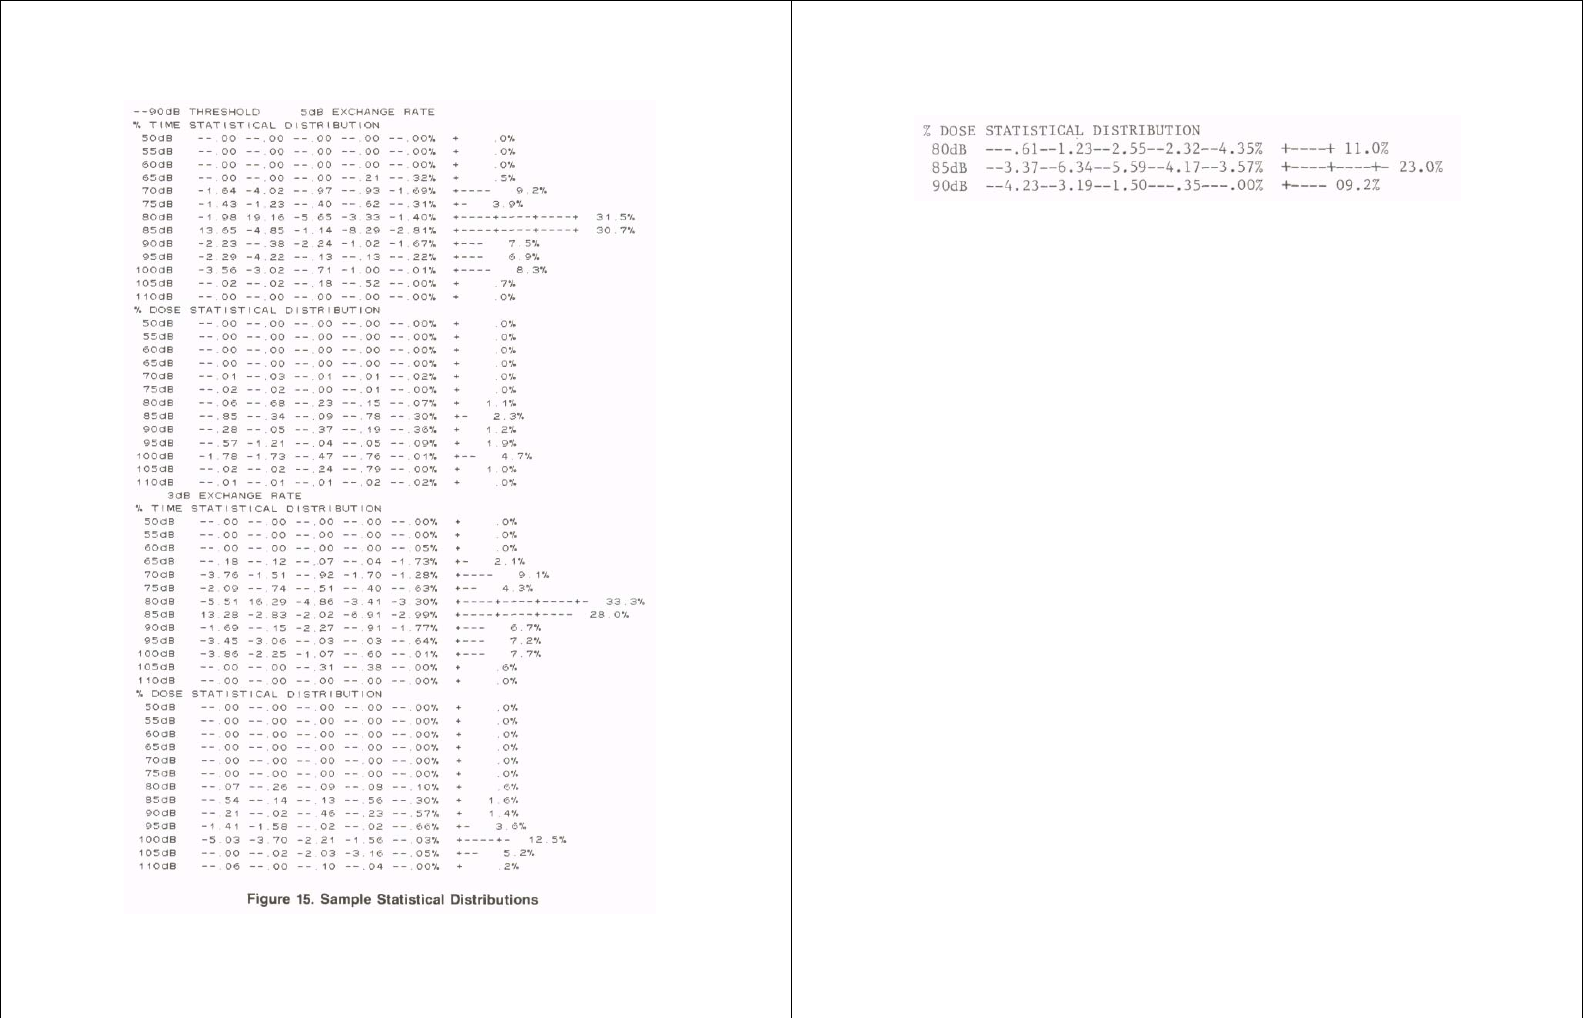
.
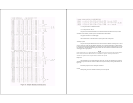
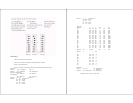
.61 is the percent dose accumulated at 80 dB.
1.23 is the percent at 81 dB, etc.
The percent dose statistical distribution is accumulated without a threshold. Of course, the dose
calculations in the summary exclude any dose accumulated below the threshold.
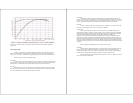
The graph is similar to the % TIME graph.
If the internal TEXT or GRAPH switch is off, that portion will not be printed.
3 dB Only Systems
The previous examples illustrated the M-27 when used with two different exchange rates. It can be
used as a 3 dB only system with three different histograms, one with no threshold and two with thresholds.
It will also print four statistical distributions, two with a Time constant and two without. If the M-27 is used
for community or 3 dB industrial monitoring, the printout will contain much more information than would
a data logger with a single printout.
NOTE
If the criterion level is set to 85 dB, then the dose reading can be easily converted to Pascal squared hours.
For a 3 dB system with a 85 dB criterion level, a 100% dose is equal to 1 Pascal squared hour. To
calculate the exposure in Pascal squared hours, divide the dose by 100.
Dump Data
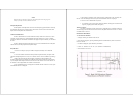
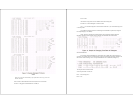
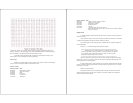
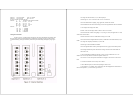
If the CODE/HL3 is cycled until the display shows CPU, raw data may be dumped to a computer
when PRINT is pressed. Each line contains an address and 16 bytes of memory starting at that address (see
Figure 16).
See Memory Map section for a description of the data.
General
When printing, the M-27 remembers which keys have been pressed


