CHAPTER 15 Working with Graphs
DataWindow Designer User’s Guide 437
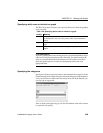
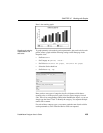
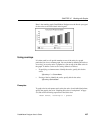
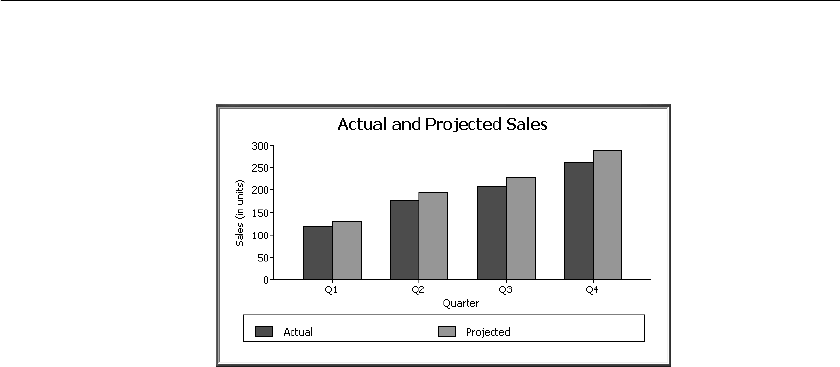
Here is the resulting graph. DataWindow Designer uses the literals you typed
for the series as the series labels in the legend:
Using overlays
It is often useful to call special attention to one of the series in a graph,
particularly in a bar or column graph. You can do that by defining the series as
an overlay. An overlay series is graphed as a line on top of the other series in
the graph. To define a series as an overlay, define it as follows:
• If specifying a column name to identify the series, specify this for the
series:
"@overlay~t" + ColumnName
• If using a label to identify the series, specify this for the series:
"@overlay~tSeriesLabel "
Examples
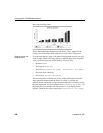
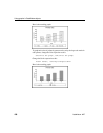
To graph sales in each quarter and overlay the sales of each individual printer,
specify the graph's data as in “Graphing unit sales of each printer” on page
434, but use the following expression in the Series box:
"Total Sales", "@overlay~t" + product


