80 Series III
Users Manual
28
Determining Pulse Width
For a periodic waveform (its pattern repeats at equal time
intervals), you can determine the amount of time that the
signal is high or low as follows:
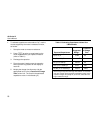
1. Measure the signal’s frequency.
2. Press Fa second time to measure the signal’s
duty cycle. Press T to select a measurement of
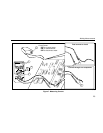
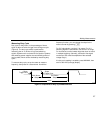
the signal’s positive or negative pulse. (Refer to
Figure 8.)
3. Use the following formula to determine the pulse
width:
Pulse Width = % Duty Cycle ÷ 100
(in seconds) Frequency
Analog Bar Graph
The analog bar graph functions like the needle on an
analog meter, but without the overshoot. The bar graph is
updated 40 times per second. Because the graph
responds 10 times faster than the digital display, it is
useful for making peak and null adjustments and
observing rapidly changing inputs.
Model 87 Bar Graph
Model 87’s bar graph consists of 32 segments. The
position of the pointer on the display represents the last
three digits of the digital display. For example, for inputs
of 500 Ω, 1500 Ω, and 2500 Ω, the pointer is near 0.5 on
the scale. If the last three digits are 999, the pointer is at
the far right of the scale. As the digits increment past 000,
the pointer wraps back to the left side of the display. The
polarity indicator at the left of the graph indicates the
polarity of the input.


