


Statistical Operations
11–7
File name 33s-English-Manual-040130-Publication(Edition 2).doc Page : 388
Printed Date : 2004/1/30 Size : 13.7 x 21.2 cm
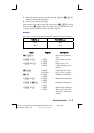
Example: Population Standard Deviation.
Grandma Hinkle has four grown sons with heights of 170, 173, 174, and 180 cm.
Find the population standard deviation of their heights.
Keys: Display: Description:
¹
¡
{
}
Clears the statistics registers.
170
/
173
/
174
/
180
/
Enters data. Four data points
accumulated.
º
+
{
σ
}
σ
σ
Calculates the population
standard deviation.
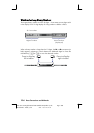
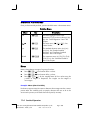
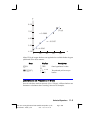
Linear Regression
Linear regression, L.R. (also called linear estimation) is a statistical method for
finding a straight line that best fits a set of
x,y–data.
Note
To avoid a
message, enter your data before
executing any of the functions in the L.R. menu.
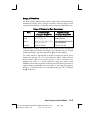
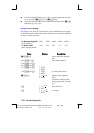
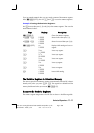
L.R. (Linear Regression) Menu
Menu Key Description
{
ˆ
} Estimates (predicts) x for a given hypothetical value of y,
based on the line calculated to fit the data.
{
ˆ
} Estimates (predicts) y for a given hypothetical value of x,
based on the line calculated to fit the data.
{
} Correlation coefficient for the (x, y) data. The correlation
coefficient is a number in the range –1 through +1 that
measures how closely the calculated line fits the data.
{
} Slope of the calculated line.
{
} y–intercept of the calculated line.