


More about Integration
E–3
File name 33s-English-Manual-040130-Publication(Edition 2).doc Page : 388
Printed Date : 2004/1/30 Size : 13.7 x 21.2 cm
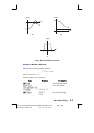
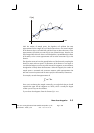
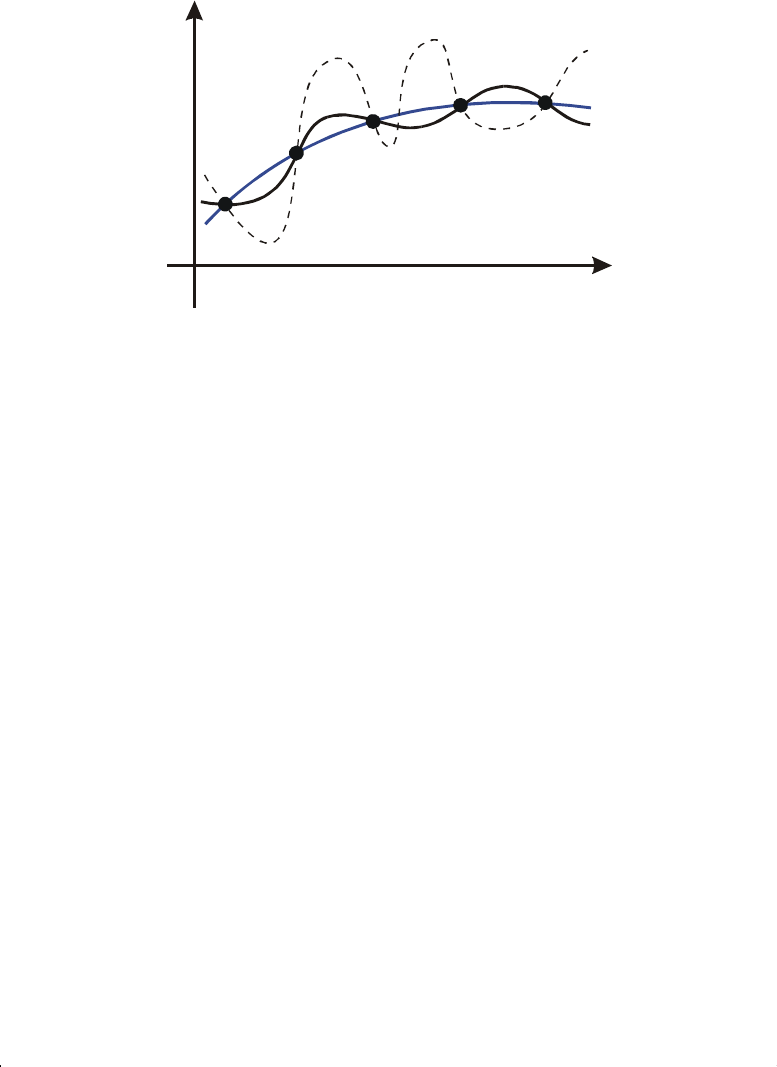
f (x)
x
With this number of sample points, the algorithm will calculate the same
approximation for the integral of any of the functions shown. The actual integrals
of the functions shown with solid blue and black lines are about the same, so the
approximation will be fairly accurate if
f(x) is one of these functions. However, the
actual integral of the function shown with a dashed line is quite different from those
of the others, so the current approximation will be rather inaccurate if
f(x) is this
function.
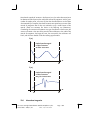
The algorithm comes to know the general behavior of the function by sampling the
function at more and more points. If a fluctuation of the function in one region is
not unlike the behavior over the rest of the interval of integration, at some iteration
the algorithm will likely detect the fluctuation. When this happens, the number of
sample points is increased until successive iterations yield approximations that
take into account the presence of the most rapid,
but characteristic, fluctuations.
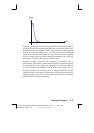
For example, consider the approximation of
.
0
∫
∞
−
dxxe
x
Since you're evaluating this integral numerically, you might think that you should
represent the upper limit of integration as 10
499
, which is virtually the largest
number you can key into the calculator.
Try it and see what happens. Enter the function
f(x) = xe
–x
.