Case Study 145
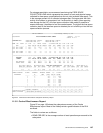
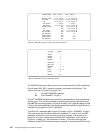
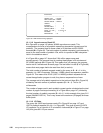
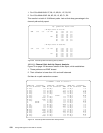
Figure 63. DB2 PM Accounting, BP4 Section
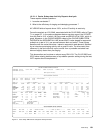
12.1.3 Suspend Times
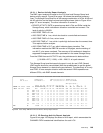
The class 3 section of the accounting report shows suspend (wait) times. This is
shown in Figure 64 on page 145. These values are only shown if the accounting
trace is started with class 3.
In this example, the wait times reported correspond to I/O. The application waited
56.77 seconds for synchronous reads (
A) and 29 minutes and 59.16 seconds for
prefetch reads (
B). This time is not directly attributable to the elapsed time,
because the I/O was performed in parallel. On Figure 57 on page 142 we have
the timing for parallelism. Only 3 minutes and 48.3 seconds (
F in Figure 57) were
in the main task (TCB). The remainder, 27 minutes and 7.7 seconds (
G in Figure
57) were performed in the five parallel tasks.
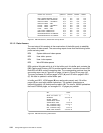
Figure 64. DB2 PM Accounting Class 3 Times
12.1.3.1 Synchronous I/O
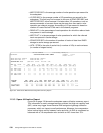
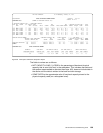
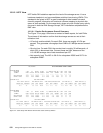
Line A in Figure 64 on page 145 shows 19559 synchronous reads. This value is
also reported as the total synchronous reads made by this query,
F in Figure 66
on page 147. The elapsed time for these reads is 56.770913 seconds. This gives
an average of 2.9 milliseconds for each read. This is a good response time for a
direct access to a page. This response time is also shown in the DB2 PM
highlights section,
D in Figure 65 on page 146.
BP4 TOTAL
--------------------- --------
BPOOL HIT RATIO (%) 50
GETPAGES 300350 F
BUFFER UPDATES 0
SYNCHRONOUS WRITE 0
SYNCHRONOUS READ 754
SEQ. PREFETCH REQS 702
LIST PREFETCH REQS 0
DYN. PREFETCH REQS 3944
PAGES READ ASYNCHR. 148634
CLASS 3 SUSP. ELAPSED TIME EVENTS
-------------- ------------ -------
LOCK/LATCH 0.060799 2760
SYNCHRON. I/O 56.770913 19559 A
OTHER READ I/O 29:59.155952 143669 B
OTHER WRTE I/O 0.000000 0 C
SER.TASK SWTCH 0.002627 2
ARC.LOG(QUIES) 0.000000 0
ARC.LOG READ 0.000000 0
DRAIN LOCK 0.000000 0
CLAIM RELEASE 0.000000 0
PAGE LATCH 0.000000 0
STORED PROC. 0.000000 0
NOTIFY MSGS 0.000000 0
GLOBAL CONT. 0.000000 0
TOTAL CLASS 3 30:55.990291 165990


