Chapter 8 279
Ways to Improve Performance
Profile-Based Optimization
A simpler approach would be to compile foo.c and bar.c with a single
cc command:
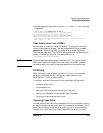
$ cc -v +I -O -o foobar bar.c foo.c
/opt/langtools/lbin/cpp bar.c /var/tmp/ctm352
/opt/ansic/lbin/ccom /var/tmp/ctm352 bar.o -O2 -I
/opt/langtools/lbin/cpp foo.c /var/tmp/ctm456
/opt/ansic/lbin/ccom /var/tmp/ctm456 foo.o -O2 -I
/usr/ccs/bin/ld /opt/langtools/lib/icrt0.o -u main -o foobar \
bar.o foo.o -I -lc
Code Generation from I-SOMs
As discussed in “Looking “inside” a Compiler” on page 38, a compiler
driver invokes several phases. The last phase before linking is code
generation. When using PBO, the compilation process stops at an
intermediate code level. The PA-RISC code generation and optimization
phase is invoked by the linker. The code generator is
/opt/langtools/lbin/ucomp.
NOTE Since the code generation phase is delayed until link time with PBO,
linking can take much longer than usual when using PBO. Compile
times are faster than usual, since code generation is not performed.
Profiling
After instrumenting a program, you can run it one or more times to
generate profile data, which is ultimately used to perform the
optimizations in the final step of PBO.
This section provides information on the following profiling topics:
• “Choosing Input Data”
• “The flow.data File”
• “Storing Profile Information for Multiple Programs”
• “Sharing the flow.data File Among Multiple Processes”
• “Forking an Instrumented Application”
Choosing Input Data
For best results from PBO, use representative input data when running
an instrumented program. Input data that represents rare cases or error
conditions is usually not effective for profiling. Run the instrumented
program with input data that closely resembles the data in a typical


