286 Chapter 8
Ways to Improve Performance
Profile-Based Optimization
+O2 Full optimization within each procedure in a file. (Can
also be invoked as -O.)
+O3 Full optimization across all procedures in an object file.
Includes subprogram inlining.
+O4 Full optimization across entire application, performed
at link time. (Invokes ld +Ofastaccess
+Oprocelim.) Includes inlining across multiple files.
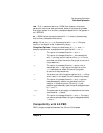
NOTE Be aware that +O3 and +O4 are incompatible with symbolic debugging.
The only compiler optimization levels that allow for symbolic debugging
are +O2 and lower.
For more detailed information on compiler optimization levels, see your
compiler documentation.
PBO has the greatest impact when it is combined with level 2 or greater
optimizations. For instance, this compile command combines level 2
optimization with PBO (note that the compiler options +O2 and -O are
equivalent):
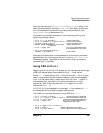
$ cc -v -O +I -c prog.c
/opt/langtools/lbin/cpp prog.c /var/tmp/ctm123
/opt/ansic/lbin/ccom /var/tmp/ctm123 prog.o -O2 -I
$ cc -v -O +I -o prog prog.o
/usr/ccs/bin/ld /opt/langtools/lib/icrt0.o -u main -o prog \
prog.o -I -lc
The optimizations are performed along with instrumentation. However,
profile-based optimizations are not performed until you compile later
with +P:
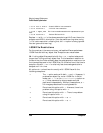
$ cc -v +P -o prog prog.o
/usr/ccs/bin/ld /usr/ccs/lib/crt0.o -u main \
-o prog prog.o -P -lc
Using PBO to Optimize Shared Libraries
Beginning with the HP-UX 10.0 release, the -I linker option can be used
with -b to build a shared library with instrumented code. Also, the -P,
+df, and +pgm command-line options are compatible with the -b option.
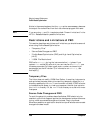
To profile shared libraries, you must set the environment variable
SHLIB_FLOW_DATA to the file that receives profile data. Unlike
FLOW_DATA, SHLIB_FLOW_DATA has no default output file. If
SHLIB_FLOW_DATA is not set, profile data is not collected. This allows
you to activate or suspend the profiling of instrumented shared libraries.


