


LER 9300
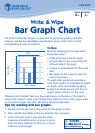
The Write & Wipe Bar Graph is a great tool for practicing graphing and data
analysis. Use the five adjustable color bands to easily create “bars” of data
corresponding to units of measure.
To Use:
Write the following on the chart with a
dry-erase marker*:
• A title at the top of the bar graph
• An axis label for the y-axis along the
left-hand side of the graph
• A scale of measurement for the y-axis
data
• Bar labels on the x-axis for each bar
used in the graph
To graph data, gently pull and slide a
color band upward or downward to adjust
its length. Hide unused bars by gently
pulling their bands around until they no
longer show in the front of the chart.
*Marker is not included. Test your dry-erase marker on the back of the board to
ensure that it doesn’t leave a permanent mark. Remove marks with a paper towel
or dry-marker eraser. The chart will warp if saturated with water.
Tips for working with bar graphs:
1. Always read the title first to learn what the bar graph is about.
2. Next, read the bar labels to find out what the bars represent.
3. Look at the axis label to see what the scale
measures and which units it employs to do so.
Does the scale measure an amount, or does it
measure a percentage?
Write & Wipe
Bar Graph Chart
L
ER 9300
© Learning Resources, Inc.
Title
Bar Labels
Axis Label
Scale
Ages
6+
Grades
1+