


Viewing Patient Data
8-10 Trends and Calculations
Trends and
Calculations
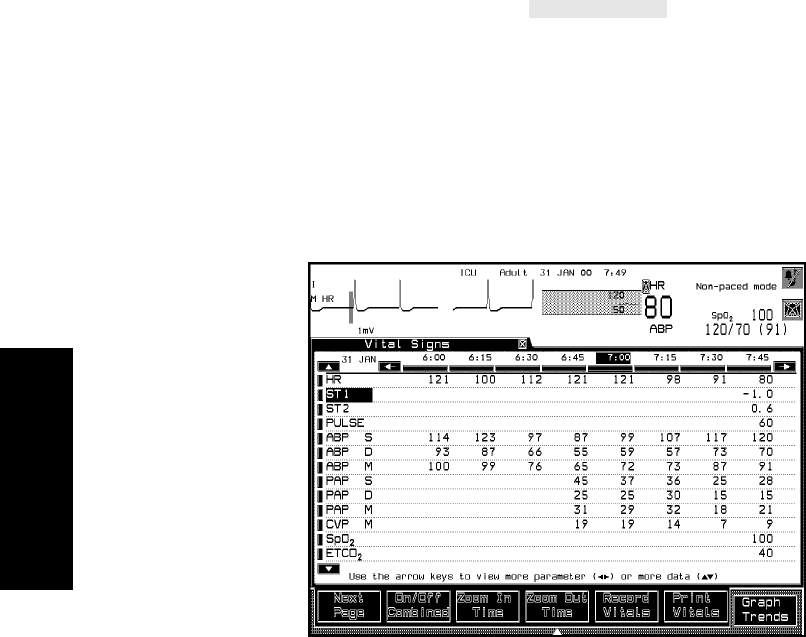
For example, when you press from a Vital Signs display
at one-minute resolution, the total time the graphs spans is 1 hour.
Conversely, when you go directly from Graph Trends with a 2-hour span
to the Vital Signs display, the intervals are 15-minute.
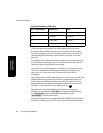
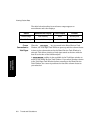
Note—If configured for the OR environment, the data is stored every 12
seconds. Depending on the patient data management configuration and
the options purchased, the default data time intervals are 1-min., 5-min.,
15-min., and 1-hr. with a maximum of 4 hours; and (CMS only) 1-min., 5-
min., 15-min., 1-hr., and 2-hrs. (with a maximum of 9 hours).
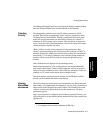
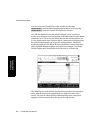
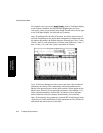
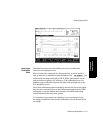
Up to 13 lines are displayed on the screen at one time. Only monitored
parameters are shown. The continuously monitored parameters are
shown in the general order in which their numeric values appear on the
Main Screen, followed by the aperiodic parameters (for example, C.O.).
Triple-valued parameters, such as ABP, are shown on three separate
lines. Parameter units (for example, beats/minute) are not shown.
Note—If the numeric for a parameter is turned OFF in the Display Setup
/ Numerics On/ Off Task Window (but the parameter is ON), the data is
still stored and will be shown in the table.
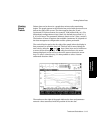
Graph Trends