


Viewing Patient Data
8-16 Trends and Calculations
Trends and
Calculations
Marking
Events
The Mark Event function enables you to mark events and then review
them in Graph Trends.
Events are labelled A, B, C, or D. You decide for your unit what each
letter means (for example, A = drug administration, B = out of bed, C =
suctioning, etc.).
For instance, you may want to mark an event such as drug
administration. Pressing the event key with the appropriate label (for
example, ) stores the event time and label. On the Graph
Trends, the event will be shown by a tick mark for that time.
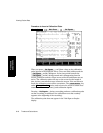
Events are shown on one line at the bottom of the Graph Trends and, if
configured, on five lines as part of a graph group. In addition to the
events that have been manually marked (Events A through D), events
that have been automatically marked through ST Segment monitoring
(ST Adjust) are also shown.
Event trends are included in reports, both scheduled reports and those
initiated from the Trends or Trends/Calcs Task Window. When “events”
is selected as part of a graph group during configuration, graphical
events trends are shown on reports whenever that group is printed. If
“events” is not configured as part of a graph group, then an event trend
is printed below the graph group.
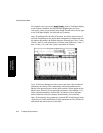
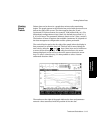
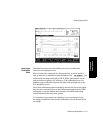
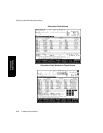
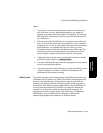
Reviewing Events can be reviewed and correlated with other graph data in two
forms:
The Events line at the bottom of all Graph Trends shows all events (A—
D and ST).
If configured, you can review events on five separate lines as part of a
graph group.
A tick mark on the line indicates that an event was recorded for that
time. When the time bar is positioned on the tick mark, the
corresponding event letter is displayed in the box below the numerics
(at the right of the graphs).
Event A