


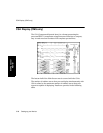
Displaying Split Screen Trends
Setting up your Monitor 3-23
Setting up your
Monitor
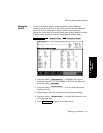
The alarm limits are represented by a rectangle, filled with the
parameter’s color at low intensity. When a measurement exceeds an
alarm limit, it is clearly visible against the screen’s black background. The
limits themselves are displayed on the right side of the trend display, next
to their corresponding boundaries.
The alarm-limit values are always displayed within the rectangle defined
by alarm limits, if they fit.
Note—Some trends, such as vital signs that are received through VueLink,
do not have alarm limits associated with them. In this case, no rectangle
is displayed for the alarm range. Instead, the default range scales are
displayed with low intensity on the left side of the trend display, to
distinguish them from alarm limits.
Trend data is only displayed for those vital signs that are positioned in the
left column of the numeric display.
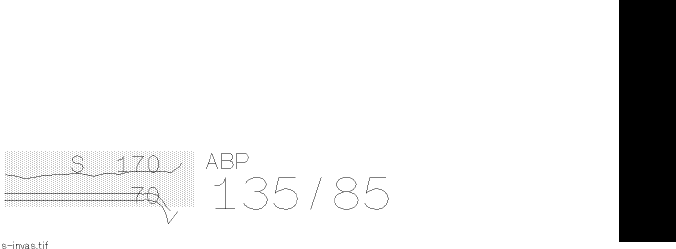
Viewing Trend
Data for
Invasive Blood
Pressure
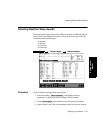
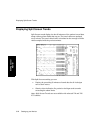
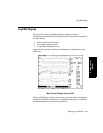
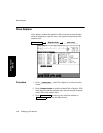
Three trend values are displayed for invasive pressure; systolic, diastolic,
and mean pressure. These three trends are displayed together as shown in
the diagram below.
Display of Trend Data for Invasive Blood Pressure - Example
The alarm limits can apply to any of the three pressures, depending on
how they are configured. The alarm limits are therefore prefixed with a
letter, which identifies the pressure to which they are configured. These
letters are:
S Systolic pressure
D Diastolic pressure
M Mean pressure