User Manual: Family of 8-bit Digitizers Page 47 of 66
• In the channels list, select a channel from the fastest digitizer (that will make that digitizer the current
digitizer).
• Make sure the maximum number of samples (MAX samples in Memory panel) is large enough.
• Select the desired time per division setting (timebase panel): the fastest sampling rate for the current
digitizer, compatible with the maximum number of samples, will be selected and applied to all digitizers
in the system. Any digitizer not capable to satisfy that sampling rate will run at its closest setting.
Finally, note that the sampling rate menu (visible in Transient Recorder mode) contains the sampling rate capability
of all digitizers currently in use. You must turn off the channels of 'slower' digitizers in order to view the highest
sampling rates of the 'faster' digitizers.
4.2.10. Segmented Memory
Segmented memory enables the sequential acquisition mode . This feature is particularly useful when capturing
impulse-response type waveforms in a variety of applications. Segmented memory is available in all acquisition
modes. However, it is generally used in either Normal or Single mode. Waveform display occurs only after all
segments are filled. Segments can be displayed sequentially on the display or they can be overlaid on top of each
other. To select an overlaid display, select the item Overlay Segments under the Options menu. Segmented data can
be archived to any storage device on the computer in a similar way to non-segmented acquisitions. If the acquisition
needs to be stopped before all segments are filled, press the Stop button.
In order to set up the sequential acquisition mode, simply select more than 1 segment on
the segment selection control under the Memory section of the control window and start the
acquisition.
4.2.11. Display Features, Zoom and Persistence
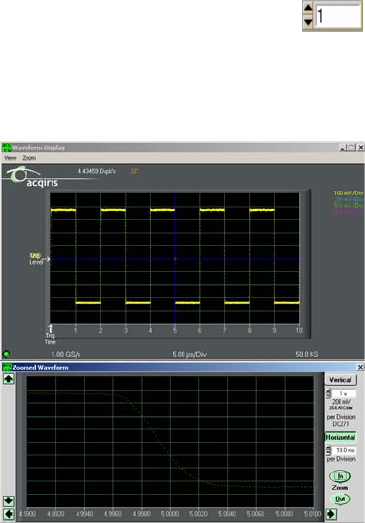
A waveform zoom feature is available under the
View menu of the display window. The screen image
below shows the normal display and the zoom
window that appears when zoom is selected.
The zoom scale and center position are modified
using the horizontal and vertical controls shown on
the zoom display window. To the right side of the
zoom window click on the “Horizontal” button, then
modify the zoom expansion factor by clicking the
“In” or “Out” buttons.
The vertical blue cursor, or box, (depending on the
zoom factor), shown on the main display window
indicates the center point and range of the zoom. The
vertical box or line can be dragged right or left with
the mouse in order to re-position the center point of
the waveform displayed in the zoom display window.
Alternatively, the right and left arrows at the bottom of the zoom display window will reposition the horizontal
center of the zoom.
In order to expand the zoom region vertically, select the “Vertical” button on the zoom display and click the “In” /
“Out” buttons. Alternatively, the up / down arrows on the scale indicator just below the vertical button can be used.
When the vertical scale is expanded, the top and bottom lines forming the blue box in the main display window show
the extent of the vertical zoom region. The vertical position of the box, and thus the data region shown on the zoom
display, may be changed by moving the box vertically with the mouse or by clicking on the up and down arrows at
the left of the zoom display window.
When expanding a waveform to the point where individual data points are seen, it may be desirable to use the
“Connect data points” option under the Options menu in AcqirisLive. When this option is selected, larger data points
are drawn on the display and a line connects each point.


