


2. RS232 Commands
2.1 Dynacolor™, Read
General Information
DynaColor™ will eliminate channel-to-channel color variations. How to define color? The CIE chromaticity diagram is one way to
plot the colors the human eye can see. A projector can only reproduce a certain color gamut within this diagram. This color gamut
is defined by the triangle formed by the x, y coordinates of Red Green and Blue. These parameters are used by the DynaColor™
adjustment in the BarcoReality SIM 4. Due to the tolerance on optical components the x, y values of this color gamut of each
projector will differ. When working with a multichannel setup, these color differences between different projectors can be smooth
out by matching the color gamuts of the different projectors to a Common Color Gamut.
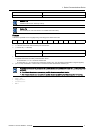
Description
Read the Dynacolor™ values of the projector.
Following values are available:
• Measured Points: x, y coordinates + Y (Luminance)
• Desired Points: x, y coordinates
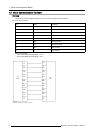
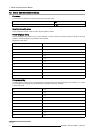
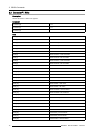
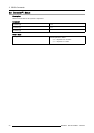
Command
Command [0]
\xfe
Command [1]
\x15
Command [2]
\x08
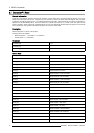
Retrun Data
Data [0]
Measured Red x msb Coordinate
Data [1]
Measured Red x lsb Coordinate
Data [2]
Measured Red y msb Coordinate
Data [3]
Measured Red y lsb Coordinate
Data [4] Measured Red Y msb Value
Data [5] Measured Red Y lsb Value
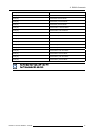
Data [6]
Measured Green x msb Coordinate
Data [7]
Measured Green x lsb Coordinate
Data [8]
Measured Green y msb Coordinate
Data [9]
Measured Green y lsb Coordinate
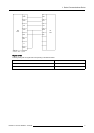
Data [10]
Measured Green Y msb Value
Data [11]
Measured Green Y lsb Value
Data [12]
Measured Blue x msb Coordinate
Data [13]
Measured Blue x lsb Coordinate
Data [14]
Measured Blue y msb Coordinate
Data [15]
Measured Blue y lsb Coordinate
Data [16] Measured Blue Y msb Value
Data [17] Measured Blue Y lsb Value
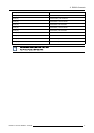
Data [18]
Measured White x msb Coordinate
Data [19]
Measured White x lsb Coordinate
Data [20]
Measured White y msb Coordinate
Data [21]
Measured White y lsb Coordinate
Data [22] Measured White Y msb Value
14 R5976614 GALAXY WARP™ 31032004