


19
APPENDIX: Fiber Optic Planning Guidelines
S
TEP
2: O
VERALL
O
PERATION
C
ONSIDERATIONS
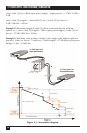
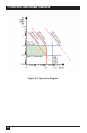
The operation diagram (Figure A-2) shows one example diagram and one blank
diagram to be completed based on real values:
1. Draw horizontal lines at the min. and max. value of the fiber optic pulse
width* of the affected units.
2. Calculate the maximum total distance based on the calculations above and
draw a vertical line.
3. Choose the correct dispersion line** based on fiber optic transmitter type*.
4. Shade the allowed operation range as shown in Figure A-2.
*To be found in the technical data section of the units’ documentation.
**Industry-standard cable quality assumed: 18 ps/(nm*km) @ 1550 nm.
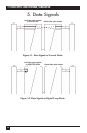
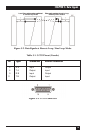
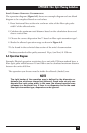
A.3 Operation Diagram
Example: Physical operation restrictions for a unit with 1550-nm standard laser, a
fiber optic pulse width between 10 and 100 ns and a calculated maximum distance
between the units of 60 km.
The operation you choose must be inside the allowed (shaded) area.
NOTE
The right border of the operation area is defined by the dispersion or
distance line, whichever comes first (leftmost). Some units use only one
discrete fiber optic pulse width. In this case, the allowed operation area
collapses to a horizontal line. If there is no dispersion line for the used
fiber optic transmitter type, dispersion can be ignored.