


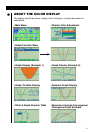
•Statistical Regression Graph Example
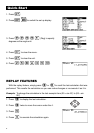
•When you draw a graph or run a program, any comment text normally appears
on the display in blue. You can, however, change the color of comment text to
orange or green.
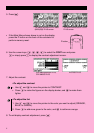
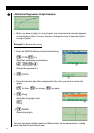
Example:
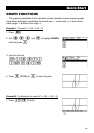
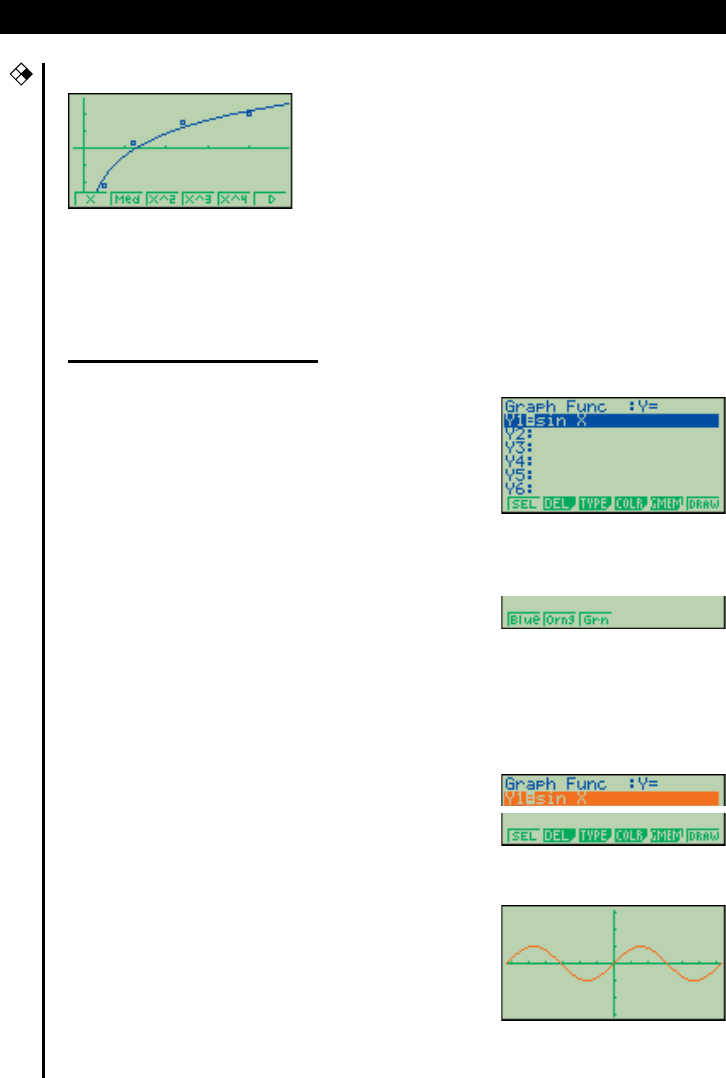
To draw a sine curve
1. Enter the GRAPH Mode and input the following.
3(TYPE)1(Y=)
(Specifies rectangular coordinates.)
svwf
4
5
(Stores the expression.)
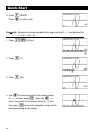
2.
4(COLR)
2
3456
•Press the function key that corresponds to the color you want to use for the
graph:
1 for blue, 2 for orange, 3 for green.
3. 2(Orng)
(Specifies the graph color.)
J
6
4.6(DRAW)
(Draws the graph)
You can also draw multiple graphs of different color on the same screen, making
each one distinct and easy to view.
iv
CFX