


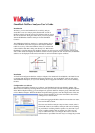

the NetFlow Analyzer is listening on. Changing the NetFlow Analyzer listen port is done by going to Tools
-> Options -> Analysis Modules -> NetFlow Analyzer, hitting the Options button, and then changing the
port as shown in the screenshot.
Router Configuration
It is important to note that in order to receive NetFlow
data, a router must be configured to send it to the
computer that the NetFlow Analyzer is running on.
Configuring a router is outside the scope of these
instructions, but I know it can be done!
Note: Keep in mind that if the router is sending NetFlow
data, and the NetFlow analyzer is not collecting it, the
computer being sent the data will respond with ICMP
Destination Unreachable packets.
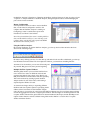
Using the NetFlow Analyzer
Ok, now the fun begins. To use the NetFlow Analyzer, go to the top level tool bar and select the icons
shown in the following image:
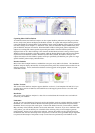
Oh what a messy desktop you have. To clean this up, and make it look more like a dashboard, go to the top
level Windows menu and select Tile. Now adjust the windows, you should see something like this:
And that's it for the monitor, you are now all knowing and
all powerful. But guess what, that's just the beginning.
Multiple NetFlow Capture Windows
With the global monitor you can collect NetFlow from
one or more Cisco routers on different networks and
aggregate the statistics into a single view. But let's say
that you would like to monitor those networks separately.
This can be achieved by creating separate NetFlow
Adapter entries for each Cisco router, and creating a
separate Capture Window for each.
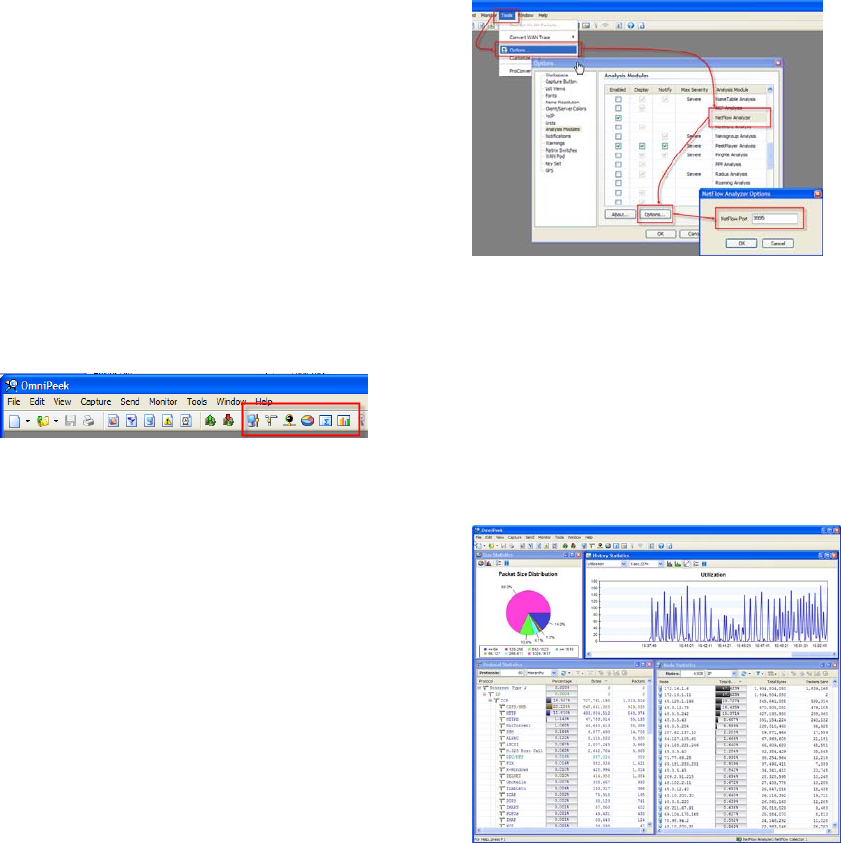
As shown in the image, the key to separating different
NetFlow feeds into separate captures is specifying the IP
address of the Cisco Router in each NetFlow Adapter
entry. Of course, you can also use a non ip specific NetFlow Adapter entry for a real-time capture window
as well and aggregate the feeds into a single capture window. The advantages of monitoring NetFlow with
a capture window instead of the global monitor is that the Dashboard, the Expert, and the PeerMap are all
capture window features, and not available in the global monitor. Below is a screen shot of a capture
window with these features.