


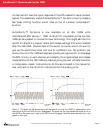


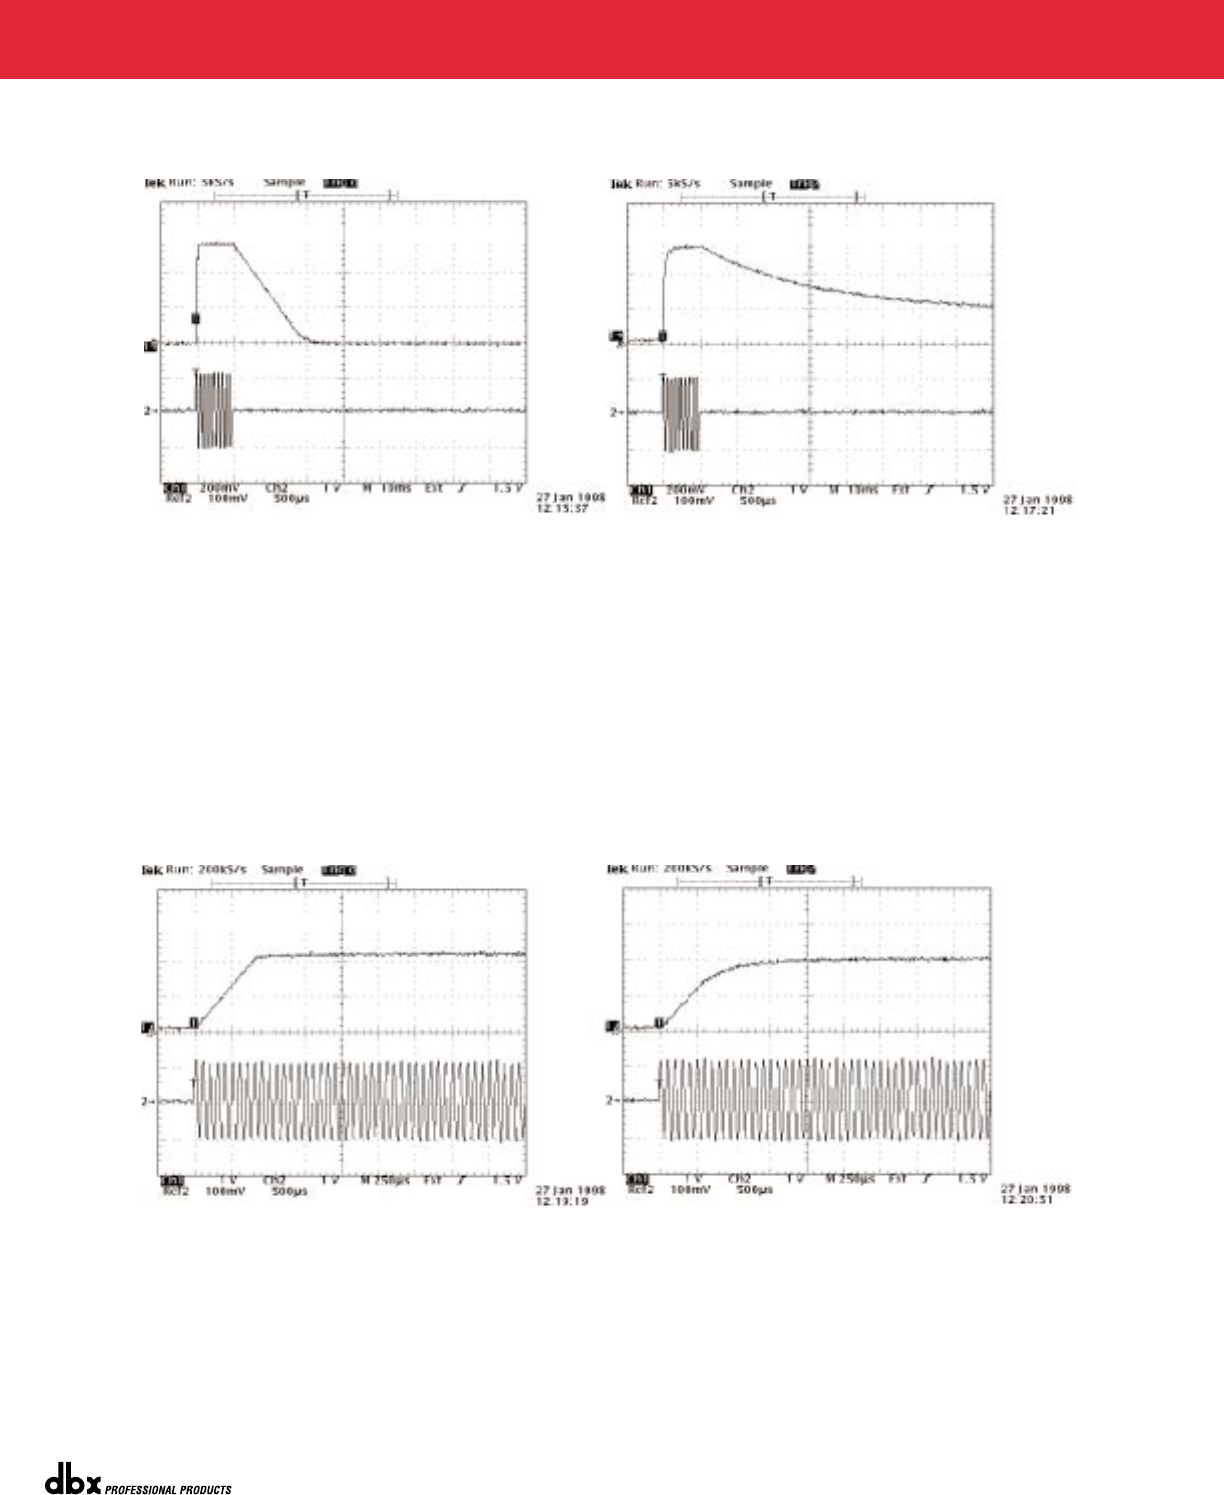
Figure 2. The graph on the left shows the small step release curve of the 160SL in response to a
sine wave burst input with AVD circuitry disengaged. The graph on the right shows the release
curve of the 160SL to the same burst input with AVD circuitry engaged. Note the slower release
time in the graph on the right.
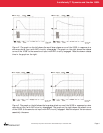
Figure 3. The graph on the left shows the large step attack curve of the 160SL in response to a sine
wave burst input with AVD circuitry disengaged. The graph on the right shows the attack curve
of the 160SL to the same burst input with AVD circuitry engaged. Note the slope of the curves are
essentially the same.
AutoVelocityª Dynamics and the dbx 160SL White Paper - November 1998
Page 4
¨
AutoVelocity™ Dynamics and the dbx 160SL