


4
ELECTRICAL CHARACTERISTICS CURVES
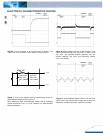
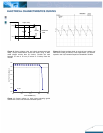
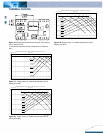
Figure5: Turn-on transient at zero load current (2 ms/div). Top
Trace: Vout (1V/div); Bottom Trace: ON/OFF Control (2V/div).
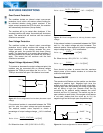
Figure 6: Output voltage response to step-change in load
current (50%-100%-50% of Io, max; di/dt = 0.1A/µs). Load
cap: 10µF, 100 m
Ω
ESR tantalum capacitor and 1µF
ceramic capacitor. Top Trace: Vout (50mV/div), Bottom
Trace: Iout (2A/div).
20﹫100KHz℃20 ℃100KHz﹫
Ω
ESR< 0.3 ESR< 0.3
TEST
12uH
Cs:68uF/100V 68uF/100V
s
i
Vi(-)
Vi(+)
Ω
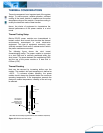
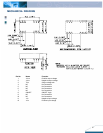
Figure 7: Test set-up diagram showing measurement points for
Input Reflected Ripple Current (Figure 8).
Note: Measured input reflected-ripple current with a simulated
source Inductance (L
TEST
)
of 12 µH. Capacitor Cs offset possible
battery impedance.
Figure 8:
. Input Reflected Ripple Current, i
s
, at full rated
output current and nominal input voltage with 12
µH source
impedance and 68
µF electrolytic capacitor (2 mA/div).