


CONFIGURATION UTILITY
Throughput
These two fields display the instantaneous wireless Receive and
Transmit throughput displayed in bytes per second. These values
are updated every two seconds.
Link Quality
The Link Quality bar graph is only active when the node is in
Infrastructure Mode. The bar graph displays the quality of the link
between the node and its Access Point. A label summarizes the
quality of the link over the bar graph, which can take on one of the
following values:
"Not Applicable"
"Poor"
"Fair"
"Good"
"Excellent"
The wireless adapter will start looking for a better Access Point if
the Link Quality becomes "Poor". Link Quality is a measure of
receive and transmit errors over the radio channel.
Signal Strength
The Signal Strength bar graph is only active when the node is in
Infrastructure Mode. The bar graph displays normalized signal
strength as reported by the radio, averaged over all frames over
100 bytes long that are received from the Access Point.
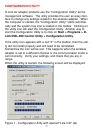
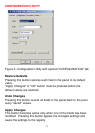
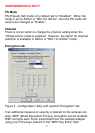
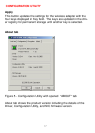
Configuration Tab
The Configuration Tab contains several fields where the operating
parameters of the wireless can be viewed and changed. Changes
to any of the parameters in the panel can be applied to the wire-
less adapter without the need to reboot the PC.
12