


Operation
Tests with 3D Resolution and Slice (3DRAS) Phantom
2
2-9
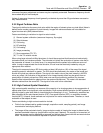
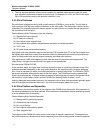
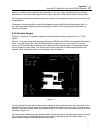
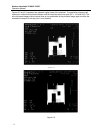
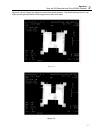
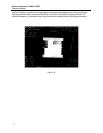
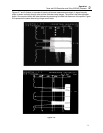
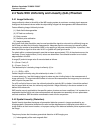
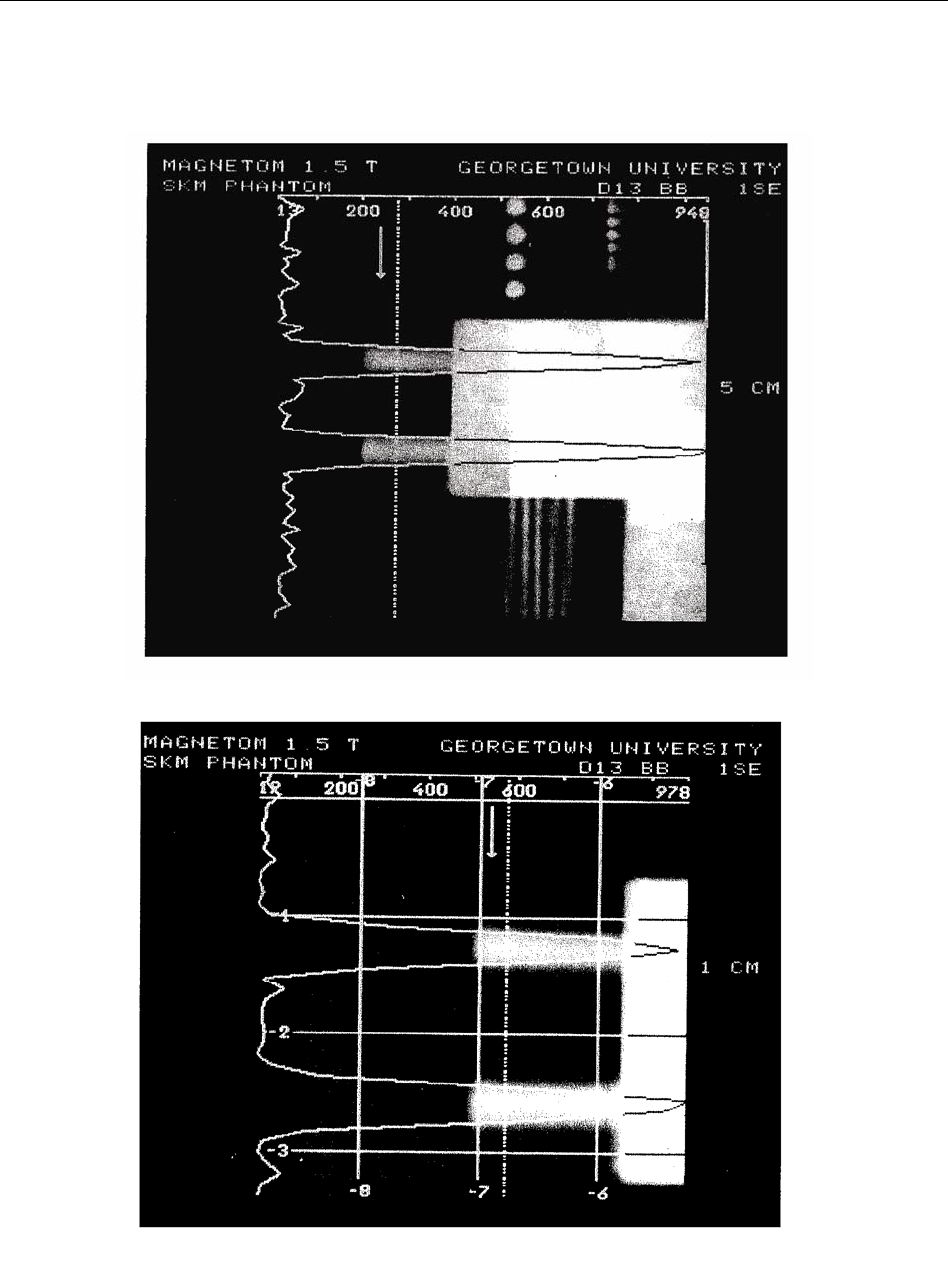
Figures 2-7 and 2-8 show an example of the slice thickness measurement analysis. A signal intensity
profile is drawn vertically through a set of slice thickness ramp Images. The profile is the slice thickness
profile. One can also obtain the slice thickness by measuring full width half maximum of the profile. Figure
2-8 represents the same data using a larger zoom factor.
Figure 2-8
Figure 2-7.