


Upgrade Guide for FortiOS v3.0
18 01-30000-0317-20060424
System New features and changes
Status
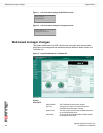
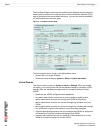
The Status page displays the System Dashboard. The System Dashboard is
categorized and five new items have been added:
• CPU, memory usage statistics history
• FortiGuard Subscription-based services and license information
• Image of the FortiGate unit’s port status settings
• Image of a FortiAnalyzer unit and its connectivity status to the FortiGate unit
• An AV/IPS/Content statistics summary table.
The System Dashboard also displays a login monitor that displays how many
administrators are logged in. This feature provides administrators (with system
configuration write access profiles) to disconnect other admin users, if required.
You can even refresh the FortiGate system and shutdown the FortiGate unit from
this page. See “Web-based manager changes” on page 12 for more information
on the System Dashboard.
Sessions
The Sessions information is now located in System > Status > Statistics.
Network
The Network tab appears in the System menu. Modem settings for the
FortiGate-60, FortiWiFi-60, and the FortiGate-50A are only available through the
CLI. See the FortiGate CLI Reference for more information.
The Options tab now has Dead Gateway Detection, previously in
System > Config > Options.
Config
The tabs for this menu have changed. The Time tab information is now located in
System > Status > System Information > System Time.
The Options tab is now available in System > Admin > Settings. This tab also
includes Virtual Domain Configuration, Web Administration Ports, including Web
Administration. The Web Administration is now called Language.
HA, SNMP v1/v2c and Replacement Messages tabs are still in the Config menu.
Operation Mode is available from this menu, and can also be found in
System > System Information > Operation Mode.
The FortiManager tab has moved to the Admin menu.