Is it raining again in Seattle…
Wait, you mean San Antonio
Å Previous – Article – Next Æ
Here are two quick problems involving fractions and number patterns. Both of these problems involve
trends in the average annual rainfall of a US city. These trends are called 50-year trends and are based on
data gathered by the National Oceanic and Atmospheric Administration (NOAA).
Two Rainy Cities?
Seattle has long been known for its cloudy, rainy weather; in fact, one of its nicknames is the Rainy City.
Since 1961, the average annual precipitation has been just less than 38 2/5”. San Antonio, on the other
hand, had an average annual precipitation of just less than 30 1/2" over the same period. According to
NOAA, San Antonio has a 50-year trend of increasing annual precipitation. If the trend continues,
eventually San Antonio will have greater annual precipitation than Seattle currently has. The trend is an
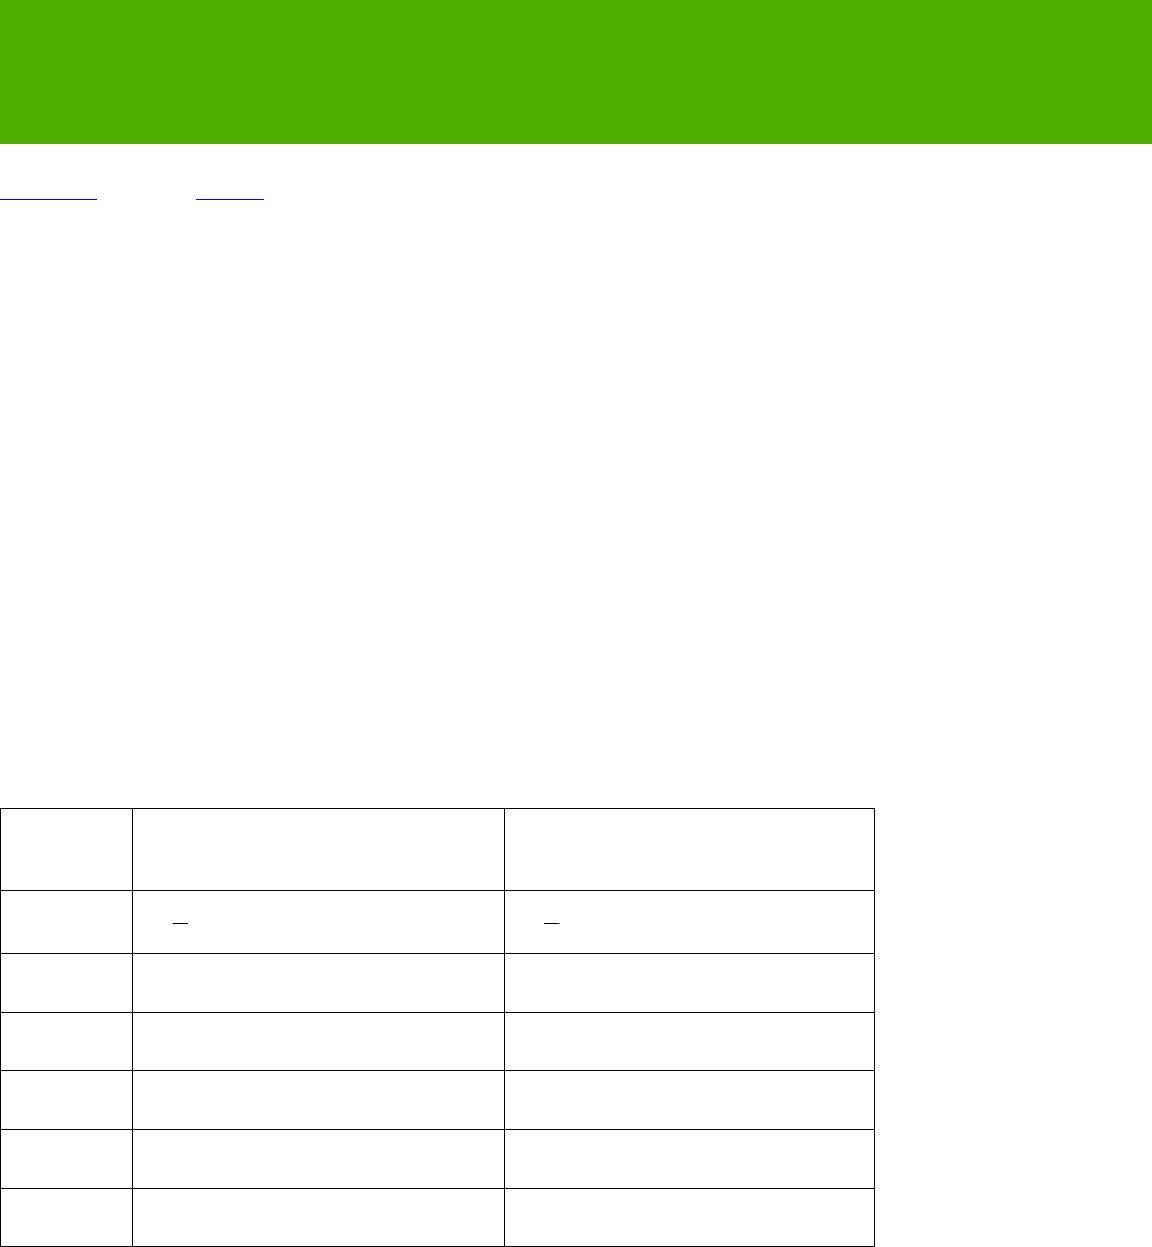
additional 1 1/8” of precipitation per decade. Use this information to fill in the first column in the table
below. Then estimate the year in which San Antonio’s annual precipitation is greater than Seattle’s current
38 2/5”.
Two Trends
Seattle, in the meantime, has its own 50-year annual precipitation trend. According to NOAA, the trend
for Seattle is a decreasing one. Seattle gets 2/3” less annual precipitation each decade. With Seattle’s
annual precipitation decreasing and San Antonio’s increasing, at some point the two cities will have the
same annual precipitation. Fill in the second column of the table below with rainfall figures. Estimate the
year in which both cities have the same annual precipitation. Show your estimate of the number of inches
of rainfall that year as well.
Year San Antonio
(average annual rainfall in
inches)
Seattle
(average annual rainfall in
inches)
2007
2
1
30
5
2
38
2017
2027
2037
2047
2057
Teacher Notes
These short activities take global warming and climatic change as topics to generate student interest in
mixed numbers and number patterns.
5


