


Canary times
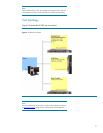
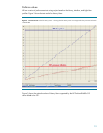
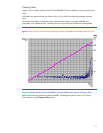
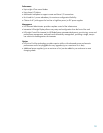
Figure 4 shows sample results for the HP ProLiant BL685c G5 server blade running a typical canary
script.
Individual user response times are shown in blue, with a yellow line depicting average response
times.
HP analyzed this figure to determine when response times began to increase markedly and
consistently over a baseline level, indicating that user response times had become unacceptable.
Figure 4. Canary time values show that response times began to become unacceptable when 340 Heavy Users were active
Figure 4 indicates that the HP ProLiant BL685c G5 server blade could support 340 Heavy Users
before response times started to increase markedly, validating the optimal value of 301 Heavy
Users derived using % Processor Time values.
14