USER RESPONSIBLE FOR VERIFYING VERSION AND COMPLETENESS
OEM FUNCTIONAL SPECIFICATION ULTRASTAR XP (DFHC) SSA MODELS 1.12/2.25 GB - 1.0" HIGH
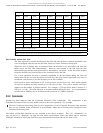
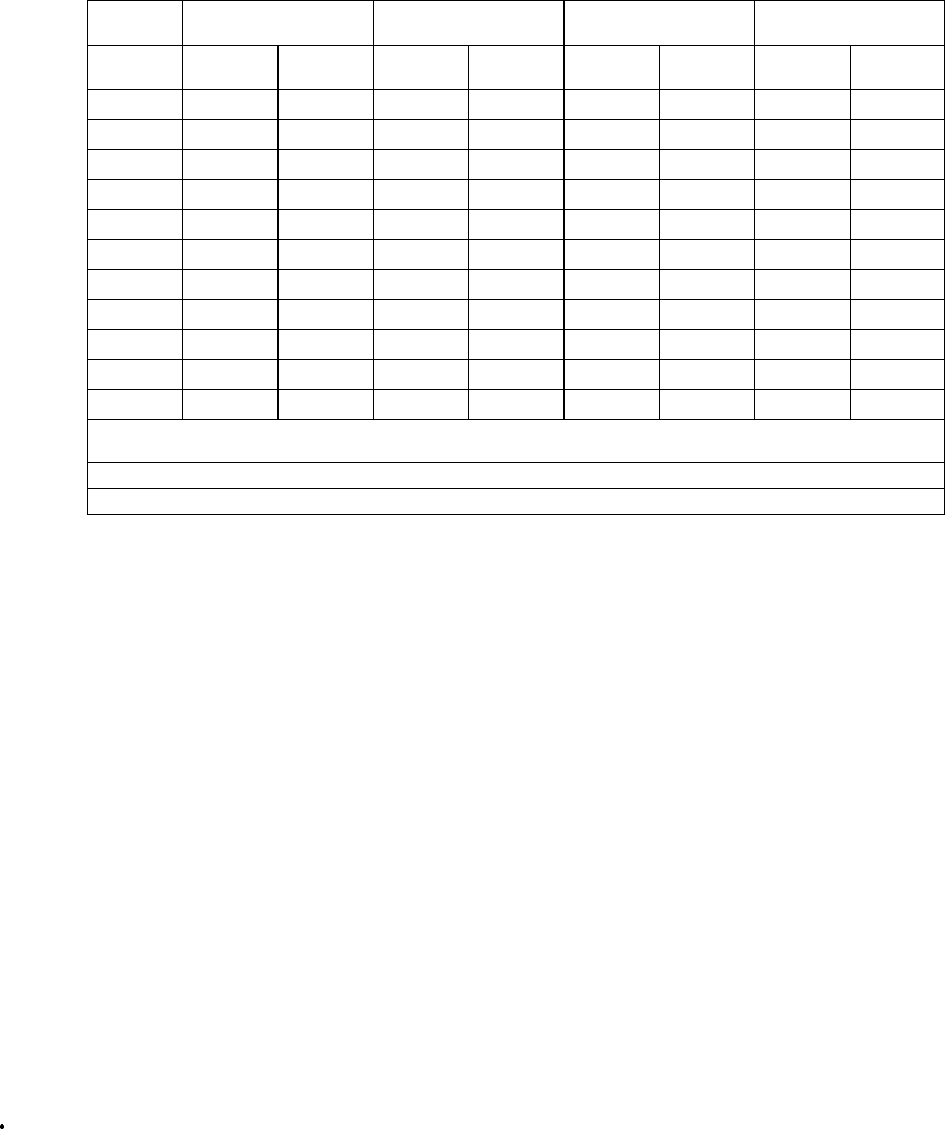
Table 7. Data Sector Transfer Rates. (All rates are in MB/sec)
Data Transfer to/from SSA Link
The time required to transfer data between the SSA link and the drive's internal data buffer, that
is not overlapped with the time for the Seek, Latency or Data Transfer to/from Disk.
When the drive is reading, data is transferred from the medium to its data buffer and from the
buffer across the SSA link simultaneously. However, data transfer to the link from the data
buffer buffer lags transfer from the medium to the buffer by one block. At the end of the transfer
from the medium, one block still has to be transferred across the link.
For a write operation, the data is normally transferred to the data buffer during the seek and
latency time. In the rare case that these are both zero, the write cannot begin until one sector is
transferred, and the time to do this becomes part of the overhead.
Each block of data is transferred as one or more frames on the SSA Link. Each frame requires
10 bytes of overhead and may contain up to 128 bytes of data. The time to transfer one block
depends on the number of frames required. For example, a 744 byte block needs 6 frames (5 x
128 byte, 1 x 10⁴). This adds 60 bytes of overhead making 804 bytes total. At an instantaneous
transfer rate of 20MB/s, that is 40 microseconds per block (17.7MB/s sustained).
3.3.2 Comments
Overlap has been removed from the Command Execution Time calculations. The components of the
Command Execution Times are truly additive times to the entire operation. For example,
The Post Command Processing times are not components of the Command Execution time therefore
they are not included in the calculation of environments where the re-instruct period exceeds the Post
Command Processing time.
The effects of idle time functions are not included in the above examples. The 3.2.1, “Sequential” on
page 40 and 3.2.2, “Random” on page 40 both define environments where the effects due to increased
command overhead of Idle Time Functions upon Command Execution time are less than 0.15%.
Model Type All C4x C2x C1x
Notch # Instant. Track Theoretical Typical Theoretical Typical Theoretical Typical
Average 12.07 7.91 7.17 7.13 7.13 7.10 7.06 7.03
1 12.58 8.30 7.52 7.48 7.48 7.44 7.40 7.37
2 12.58 8.30 7.52 7.48 7.48 7.44 7.40 7.37
3 12.51 7.99 7.22 7.18 7.18 7.15 7.11 7.08
4 11.96 7.74 7.02 6.99 6.99 6.95 6.92 6.89
5 11.26 7.38 6.66 6.63 6.63 6.60 6.57 6.54
6 11.05 7.07 6.41 6.38 6.38 6.35 6.31 6.28
7 10.64 6.88 6.23 6.20 6.19 6.16 6.13 6.10
8 10.29 6.64 6.03 6.00 6.00 5.97 5.94 5.91
9 10.01 6.45 5.85 5.83 5.83 5.80 5.77 5.74
10 9.59 6.15 5.55 5.53 5.53 5.50 5.48 5.45
Note: The values for Typical Data Sector Transfer Rates assume a typically worst case value of 3.16 errors in 10
9
bits read at
nominal conditions for soft error rate.
Note: Contact an IBM Customer Representative for values when formatted at other block lengths.
Note: "Average" values are sums of the individual notch values weighted by the number of LBAs in the associated notches.
Source filename=PERFORMIBM CorporationPage 42 of 87


