


Intel
SSD DC S3500 Workload Characterization in RAID Configurations
White Paper December 2013
12 329903-001US
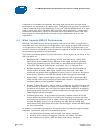
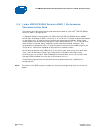
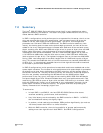
Figure 3. RAID 1 Random 90% Read @ 4KB Transfer Size with
Average Latency
Intel internal testing, October 2013
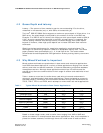
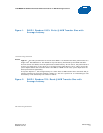
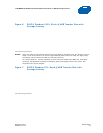
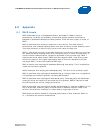
Figure 4. RAID 1 Random 100% Read @ 4KB transfer size with
Average Latency
Intel internal testing, October 2013
Notes:
Figures 2, 3 - In mixed workloads, 70% read and 90% read, IOPS increase with additional drives
and show slightly exponential growth with deeper queues.
Figures 2, 3, 4 - Average latency for 70% read starts out similar to 100% write, but the progression
is not as steep through deeper queues, ending between 500-600 µS. Average latency for 90% read
and 100% read continue to improve due to the higher speed of reads over writes.
Figures 2, 3, 4 - The latency of the two drive set is lower than other drive counts as read
percentage increases due to the manner in which the LSI controller deals with the additional drives.
This is expected behavior. For more information, please contact LSI for details.
Figure 4 - At 100% read the IOPS performance scales linearly. In other words, the IOPS for four
drives is double that of two drives, six drives is triple that of two drives, and eight drives is four
times that of two drives.