


Chapter 3 Making Grayscale and Color Measurements
© National Instruments Corporation 3-11 IMAQ Vision for LabWindows/CVI User Manual
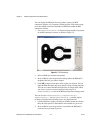
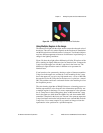
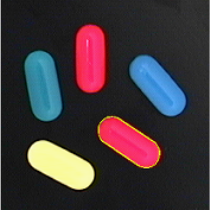
Figure 3-8. Using a Single Region to Learn Color Distribution
Using Multiple Regions in the Image
The interaction of light with the object surface creates the observed color of
that object. The color of a surface depends on the directions of illumination
and the direction from which the surface is observed. Two identical objects
may have different appearances because of a difference in positioning or a
change in the lighting conditions.
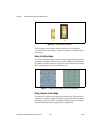
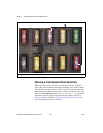
Figure 3-9 shows how light reflects differently off of the 3D surfaces of the
fuses, resulting in slightly different colors for identical fuses. Compare the
3-amp fuse in the upper row with the 3-amp fuse in the lower row. The
difference in light reflection results in different color spectrums for
identical fuses.
If you learn the color spectrum by drawing a region of interest around the
3-amp fuse in the upper row, and then do a color matching for the 3-amp
fuse in the upper row, you get a very high match score—close to 1000. But
the match score for the 3-amp fuse in the lower row is quite low—around
500. This problem could cause a mismatch for the color matching in a fuse
box inspection process.
The color learning algorithm of IMAQ Vision uses a clustering process to
find the representative colors from the color information specified by one
or multiple regions in the image. To create a representative color spectrum
for all 3-amp fuses in the learning phase, draw an ROI around the 3-amp
fuse in the upper row, hold down the <Shift> key, and draw another ROI
around the 3-amp fuse in the lower row. The new color spectrum represents
3-amp fuses better and results in high match scores (around 800) for both
3-amp fuses. Use as many samples as you want in an image to learn the
representative color spectrum for a specified template.