


EL-9600/9400 Graphing Calculator
3
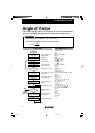
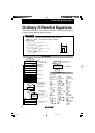
DisplayStep
Key Operation
1
2
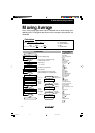
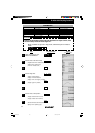
Enter statistical data into
L1 and L2.
…
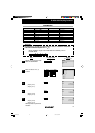
Exercise
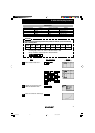
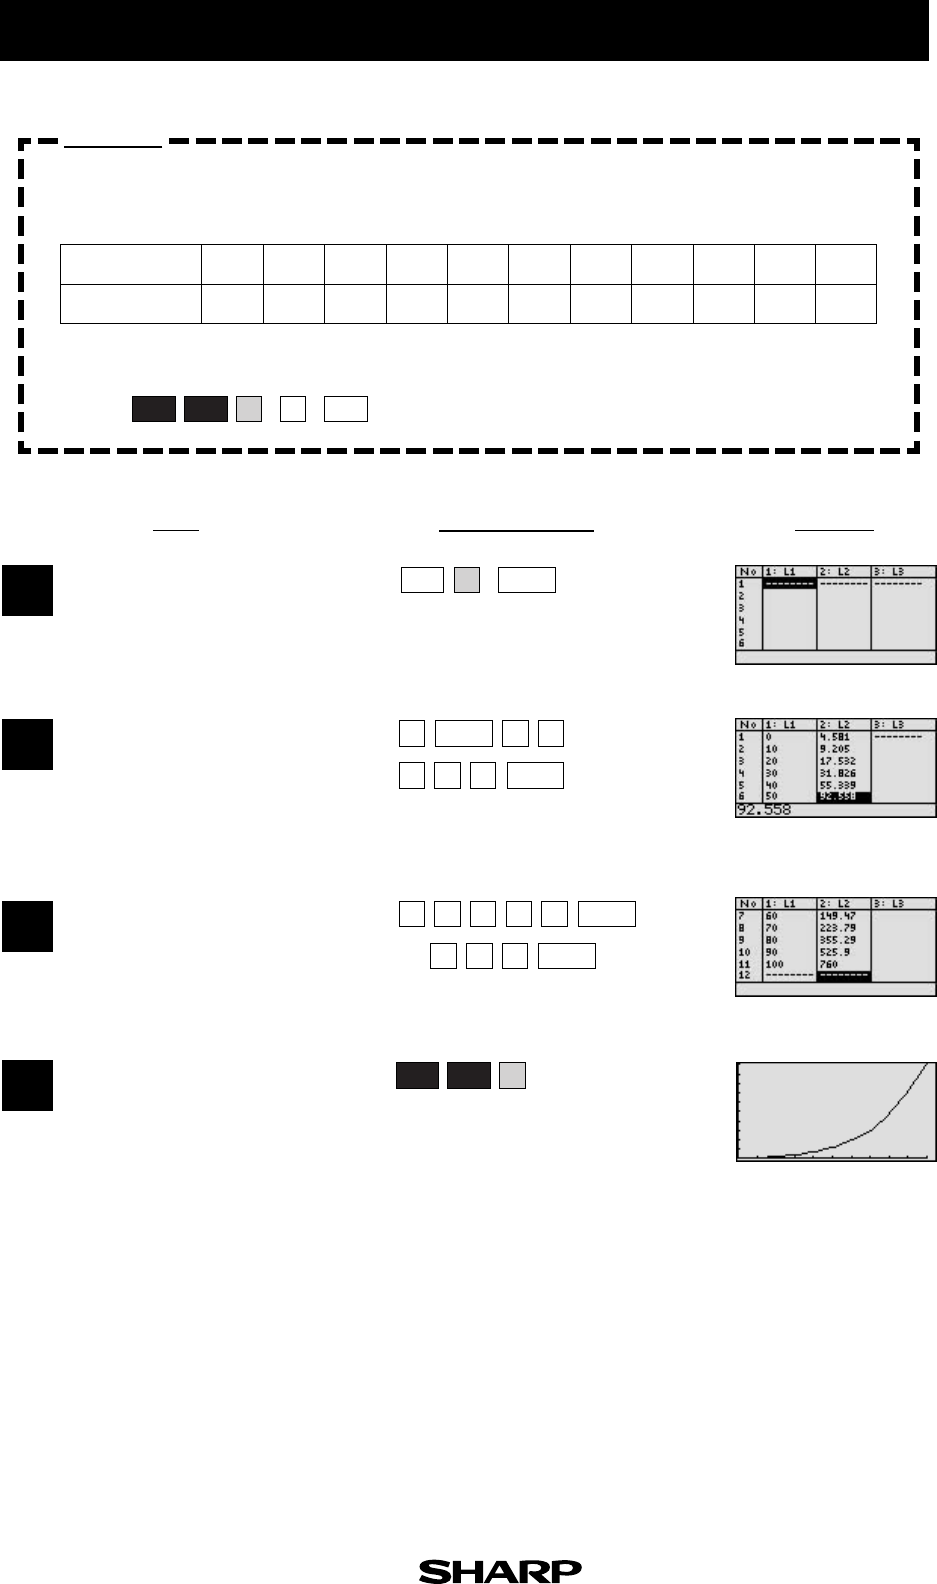
The following table shows examined water vapour pressure. Draw a graph
of this data.
Set up condition: decimal point in Float Pt Mode.
*
*
Temperature [˚C]
Pressure [mmHg]
0
4.581
10
9.205
20
17.532
30
31.826
40
55.339
50
92.558
60
149.47
70
223.79
80
355.29
90
525.90
100
760.00
…
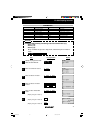
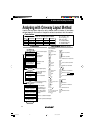
4
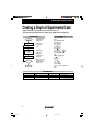
Specify the programme mode.
Select the title XY GRAPH.
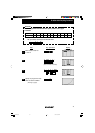
(Drawing of graph)
*
(Other numbers not shown)
*
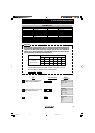
19
SET UP
2nd F
CL1C
ENTER
STAT
A
2nd F
PRGM
A
0
ENTER
67
1
ENTER
85
0
ENTER
01
0
ENTER
01
4•
(When using EL-9600)
HB2.Doc02. 98.10.1, 0:29 PM19