NotesKey Operation
Display
Example
6
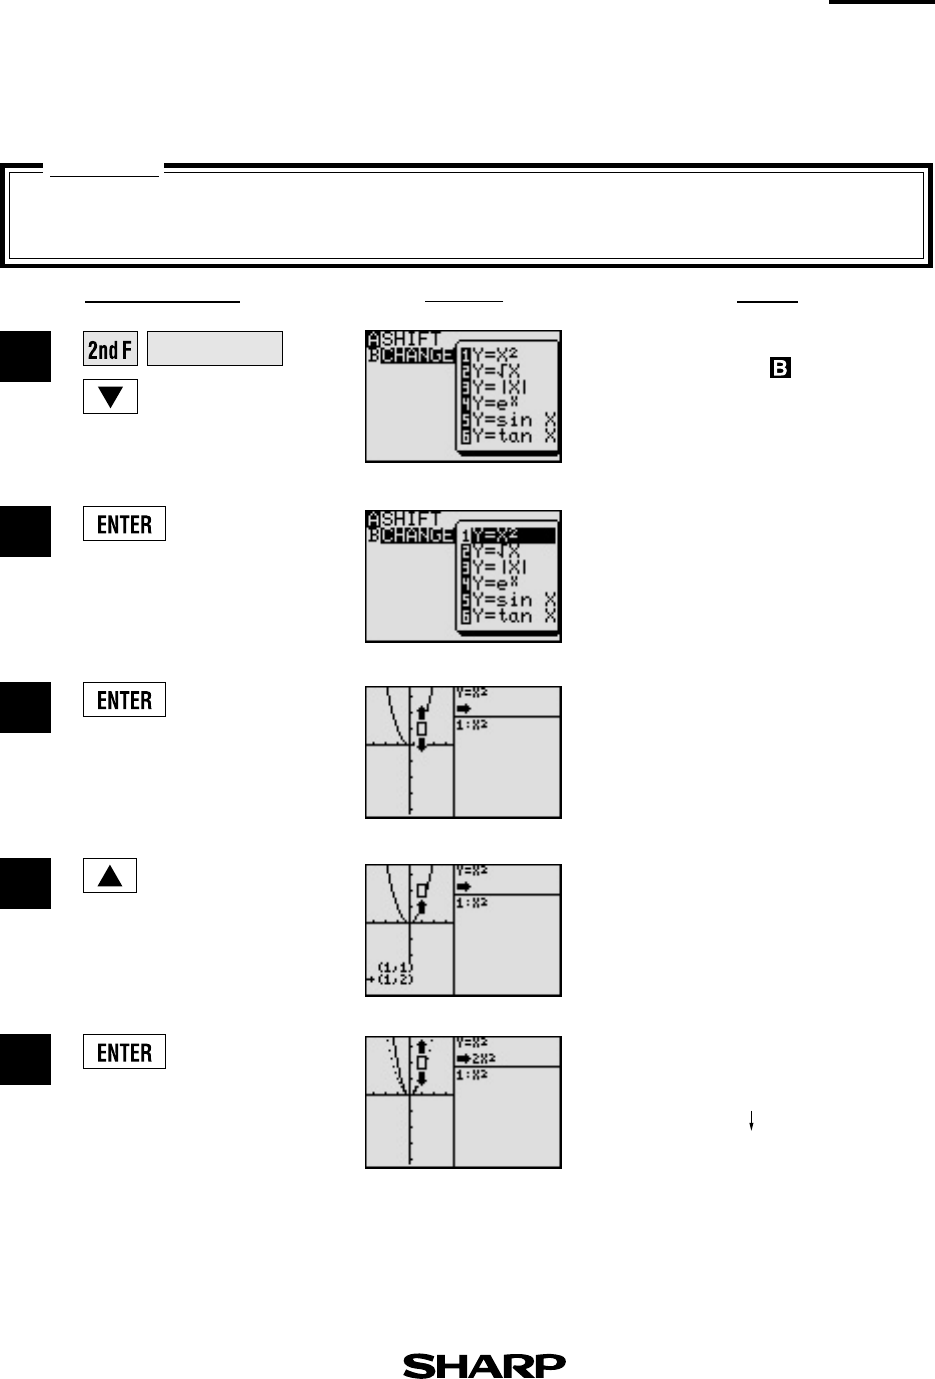
When the graph of y = x
2
is changed,
how does it affect the equation?
Change
Graph change function helps students grasp the relationship between an equation and its
graph. Change the shape of the graph, and the change is immediately reflected in the equation
on the right side of the display.
Enter
SHIFT/CHANGE
mode
and specified (
CHANGE
).
1
3
4
5
2
Select change. Cursor will move
to the equation menu.
Select the equation: y = x
2
and
draw the graph.
View the result of the change.
Select the location of the
change: increase the value of y-
coordinates.
SHIFT/CHANGE
(Change the shape of the graphs)
Features
y = x
2
y = 2x
2
]
]


