


ToolStick Debug Adapter
Rev. 0.1 3
4. Hardware Setup using a ToolStick Debug Adapter
Configure the ToolStick Debug Adapter
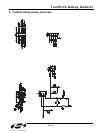
1. Place the jumper J1 in the appropriate position for the I/O voltage of the Target Board being used. Connect pins
1 and 2 (V
REG
and V
IO
) for 2.5 V I/O or connect pins 2 and 3 (V
DD
and V
IO
) for 3.3 V I/O.
2. If the Target Board will be powered from the ToolStick Debug Adapter, place a jumper on header J2. If the
Target Board will be separately powered, ensure that no jumper is installed on header J2.
Note: Powering the Target Board from the ToolStick Debug Adapter and a separate power supply at the same time could
cause damage to the ToolStick Base Adapter and/or the Target Board.
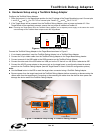
Figure 4. ToolStick Debug Adapter Jumpers
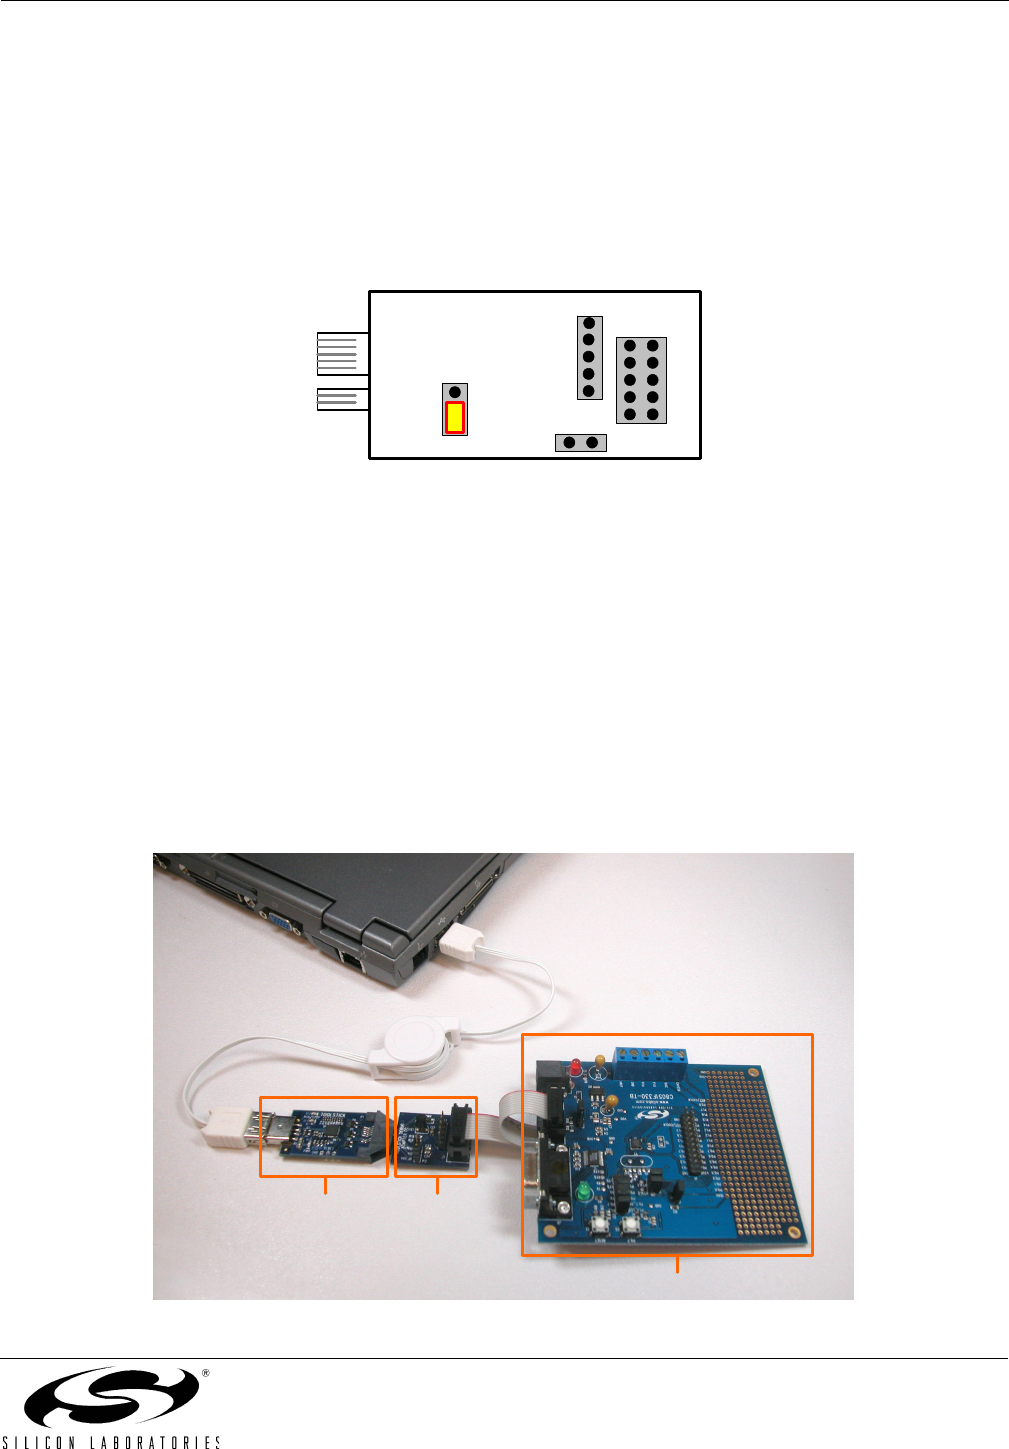
Connect the ToolStick Debug Adapter to the Target Board as shown in Figure 5.
1. If not already assembled, insert the ToolStick Debug Adapter into a ToolStick Base Adapter.
2. Connect the 10-pin ribbon cable from the ToolStick Debug Adapter to the Target Board debug header.
3. Connect one end of the USB cable to the USB connector on the ToolStick Debug Adapter.
4. Connect the other end of the USB cable to a USB port on the PC that will run the Silicon Laboratories IDE.
5. Connect the AC/DC power adapter to the power jack on the target board, or configure the board to receive
power from the ToolStick Debug Adapter (see the Target Board Kit User’s Guide for configuration options).
Notes:
Use the Reset button in the IDE to reset the target when connected using a ToolStick Debug Adapter.
Remove power from the target board and the ToolStick Debug Adapter before connecting or disconnecting the
ribbon cable from the target board. Connecting or disconnecting the cable when the devices have power can
damage the device and/or the ToolStick Debug Adapter.
Figure 5. Hardware Setup Using a ToolStick Debug Adapter
P2
J3
J1
J2
Target Board
ToolStick
Base Adapter
Debug
Adapter