


ZyXEL NWD-170N User’s Guide
Chapter 4 Wireless Configuration 37
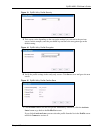
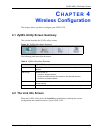
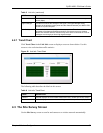
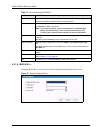
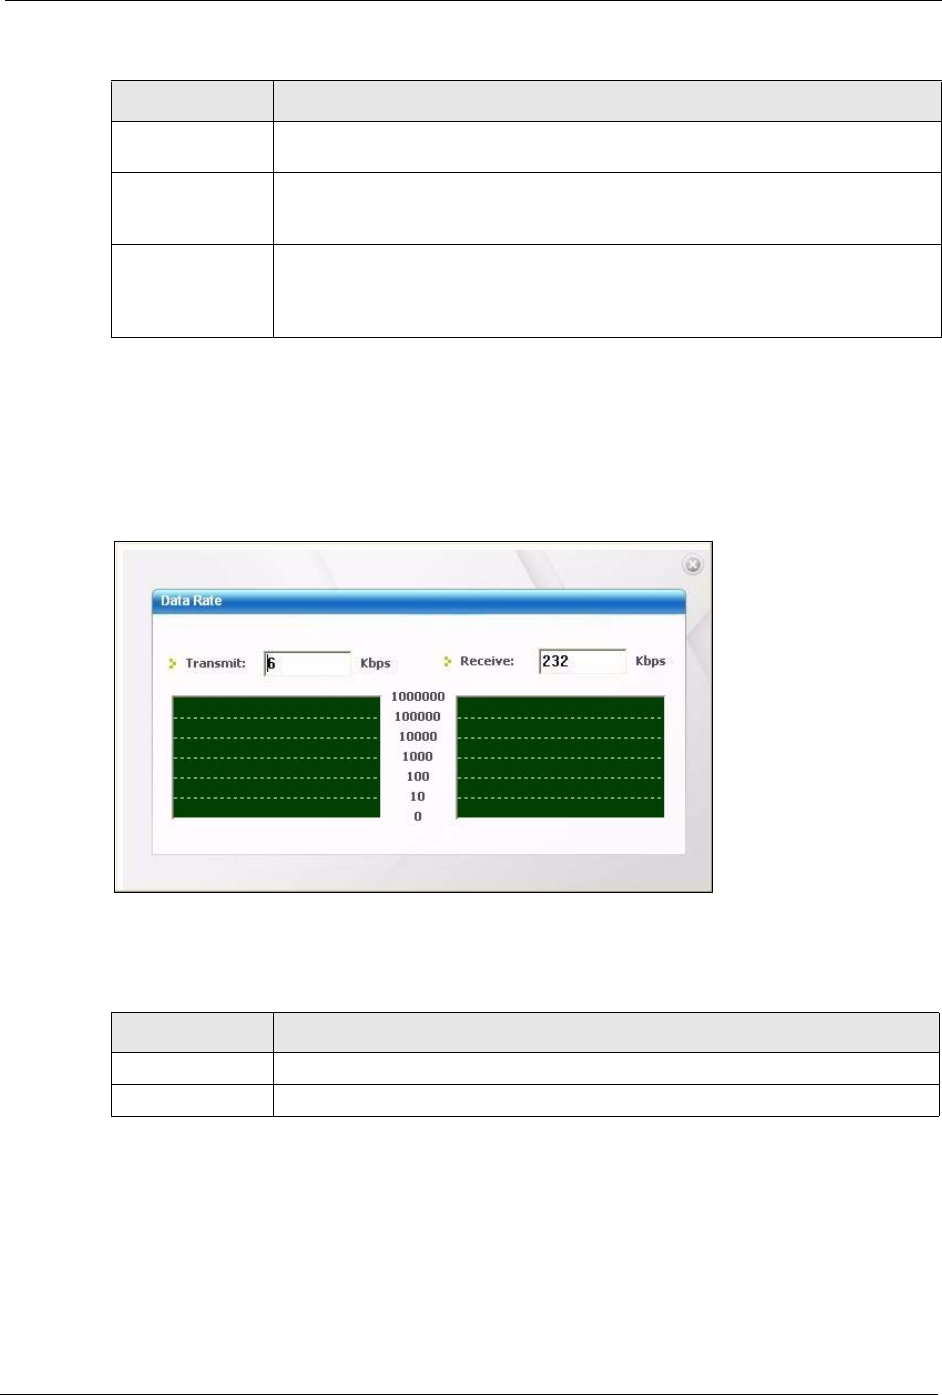
4.2.1 Trend Chart
Click Trend Chart in the Link Info screen to display a screen as shown below. Use this
screen to view real-time data traffic statistics.
Figure 20 Link Info: Trend Chart
The following table describes the labels in this screen.
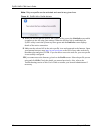
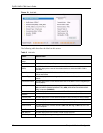
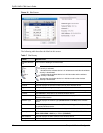
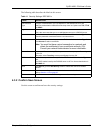
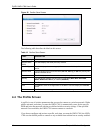
4.3 The Site Survey Screen
Use the Site Survey screen to scan for and connect to a wireless network automatically.
Trend Chart Click this button to display the real-time statistics of the data rate in kilobits per
second (Kbps).
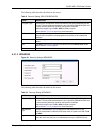
Signal Strength The status bar shows the strength of the signal. The signal strength mainly
depends on the antenna output power and the distance between your NWD-170N
and the AP or peer computer.
Link Quality The status bar shows the quality of wireless connection. This refers to the
percentage of packets transmitted successfully. If there are too many wireless
stations in a wireless network, collisions may occur which could result in a loss of
messages even though you have high signal strength.
Table 5 Link Info (continued)
LABEL DESCRIPTION
Table 6 Link Info: Trend Chart
LABEL DESCRIPTION
Transmit This field displays the current data transmission rate in kilobits per second (Kbps).
Receive This field displays the current data receiving rate in kilobits per second (Kbps).