14 Agilent U1251A/U1252A User’s and Service Guide
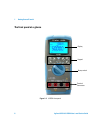
1 Getting Started Tutorial
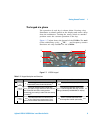
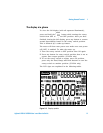
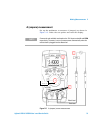
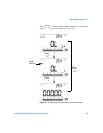
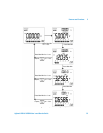
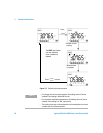
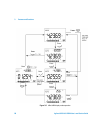
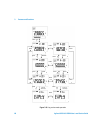
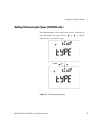
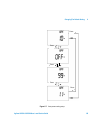
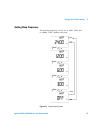
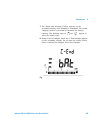
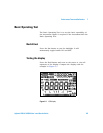
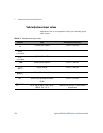
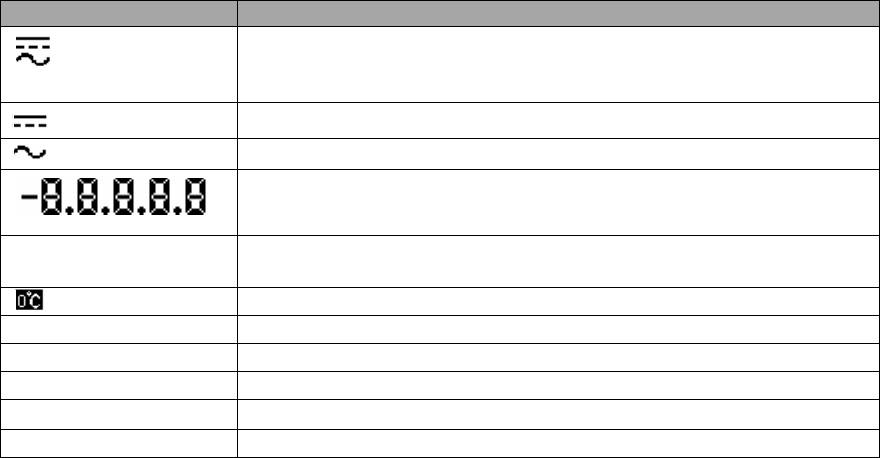
The secondary display signs are explained below.
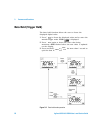
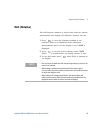
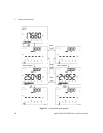
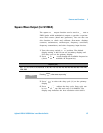
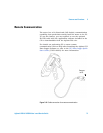
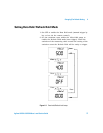
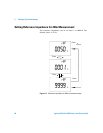
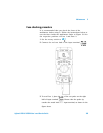
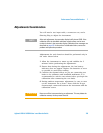
The analog bar emulates the needle on an analog multimeter,
without displaying the overshoot. When measuring peak or
null adjustments and viewing fast- changing inputs, the bar
graph provides a useful indication because it has quicker
update rate for fast response applications.
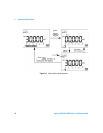
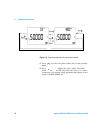
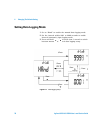
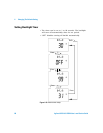
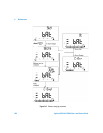
The bar graph is not used for square wave output, frequency,
duty cycle, pulse width, 4–20 mA% scale, 0–20 mA% scale
and temperature measurements. When frequency, duty cycle,
and pulse width are indicated on the primary display during
voltage or current measurement, the bar graph represents
the voltage or current value. When 4–20 mA% scale or
0–20 mA% scale is indicated on the primary display, the bar
graph represents the current value and not the percentage.
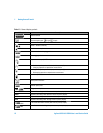
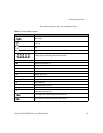
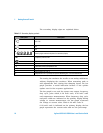
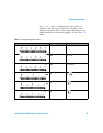
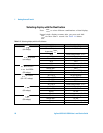
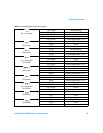
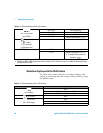
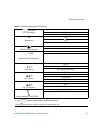
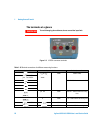
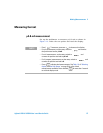
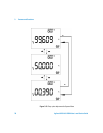
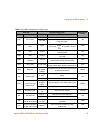
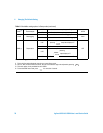
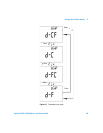
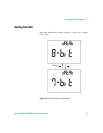
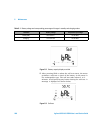
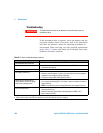
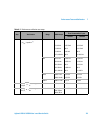
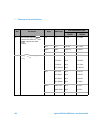
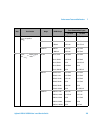
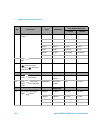
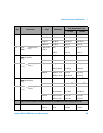
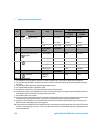
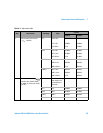
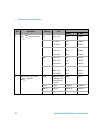
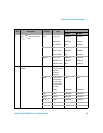
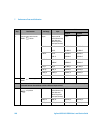
Table 1-5 Secondary display symbols
LCD symbol Description
AC + DC
DC
AC
Polarity, digits and decimal points for secondary display
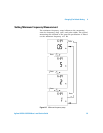
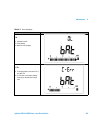
kHz Frequency units: Hz, kHz
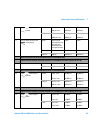
No ambient temperature compensation, just thermocouple measurement
ºC
Celsius ambient temperature unit
ºF
Fahrenheit ambient temperature unit
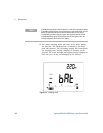
mV
Voltage units: mV, V
µmA
Current units:
µA, mA, A
s
Elapsed time unit: s (second) for Dynamic Recording and 1 ms Peak Hold modes