3.9.4
3 - 123
3.9.4 X-ray Analysis Mode
Scanning modes for analysis is available in the Full and Small screen modes.
Use the SCAN MODE block in the operation panel.
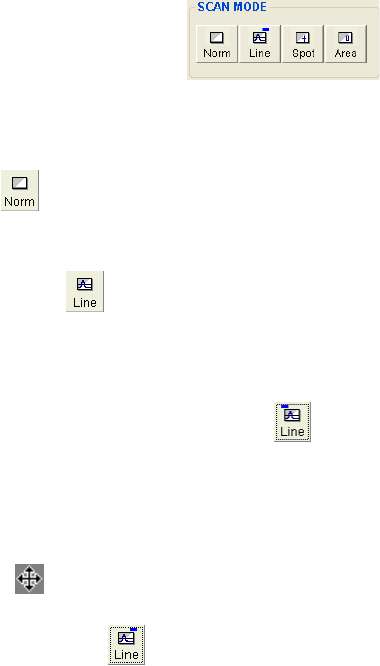
Fig. 3.9-13 SCAN MODE Window
(1) Normal mode
Normal image observation mode. Click this to return from analysis modes.
(2) Line Analysis mode
Displays a line profile of the signal intensity as a horizontal line in the observed image.
The Line Analysis button is used for two scanning modes as follows.
(a) Position Set mode for Line Analysis
Upon the first click of the button in other scanning modes or in Line Analysis mode, a
horizontal dotted line cursor is shown on the image. This line cursor corresponds to a
position of the scanned line in Line Analysis mode. To position the line cursor, locate
the mouse icon near to the line. When the mouse cursor is changed to an intersecting
arrow mark
, drag the line cursor with the mouse while holding down the left button.
(b) Line Analysis mode
When the Line Analysis button is clicked in Position Set mode, the scanning image is
frozen and a waveform, which is a profile of the signal intensity of the line, is shown on
the image. You can move the line cursor in this mode with the same operation as
above, and you can change scanning speeds.
Use Scanning Speed buttons to select line scan speed. TV or Fast scans with fast
speed, useful for SE or BSE signal profiling. Slow1 to Slow5 scans with slow speed,
used for X-ray intensity profiling.
When the Back Ground in the LINE PROFILE SIGNAL block on the Setup dialog
window - Image tab is checked, the line profile is overlaid on the image. When it is not
checked, only the line profile is shown on the screen.


