


9Section 61245207L2-5, Issue 261245207L2-5C
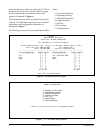
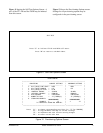
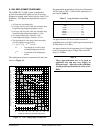
The Current System Status Screen, illustrated in
Figure 8, provides quick access to FT1 DP status
information.
The Elapsed Time display indicates the period of time
since the unit began collecting performance
information. At each 15-minute interval, the
performance information is transferred to the
15-minute performance data registers accessed from
the Performance History screen. At each 24-hour
interval, the performance data is transferred into the
24-hour performance data register also accessed using
this screen.
Figure 8 consolidates current information for the DSL
and DS1 interfaces. A key to the information
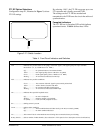
provided is found in the center of the screen. Arrows
indicate the key applies to the FT1 DP. The following
defines terms used on this screen:
LOSS ....................... Pulse Attenuation
Measurement
SYNC ...................... DSL Loop 1 Sync Status
ES 15M/24H ............ Errored Seconds
SES 15M/24H.......... Severely Errored Seconds
UAS 15M/24H......... Unavailable Seconds
Figure 8. Current System Status Screen
FT1-DP CURRENT SYSTEM STATUS FNID
NETWORK (DSL) ELAPSED TIME 00:08:18 CUSTOMER (DSL)
----------------------- -------------------
00 dB <- LOSS -> 00 dB
NO <- SYNC -> NO
000/00000 <- ES 15M/24H -> 000/00000
000/00000 <- SES 15M/24H -> 000/00000
498/00498 <- UAS 15M/24H -> 498/00498
LOOPBACKS INACTIVE LOOPBACKS INACTIVE
FT1-DP SIGNAL QUALITY FNID DS1 FNID SIGNAL QUALITY
[ ] 9 -------------------- [ ] 9
[ ] 8 FRAME ——> SF [ ] 8
[ ] 7 CODE ——> AMI [ ] 7
[ ] 6 LBO ——> 0 dB [ ] 6
[ ] 5 BPV ——> 00000 [ ] 5
[ ] 4 ES ——> 00000 [ ] 4
[ ] 3 SES ——> 00000 [ ] 3
[ ] 2 UAS ——> 00000 [ ] 2
[ ] 1 ALARMS ——> NONE [ ] 1
[ ] 0 NO SEALING CURRENT [ ] 0
Press “Z” to zero registers, “M” for Main Menu.
NOTE
The first number is for the current 15-minute
period. The second number is for the current
24-hour period.
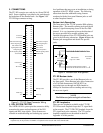
A measure of signal quality for each DSL loop is
graphically depicted on the bottom right and left of the
screen. The measure is from 0 to 9 (poor to excellent
signal quality). Guidelines for interpreting the
indicators are:
0 ......... Poor signal quality. Noise margin is ≤ 0 dB
(≈10
-7
BER).
1-8 ...... Margin measurement above 10
-7
BER in dB.
9 ......... Excellent signal quality. Margin is ≥ 9 dB
above 10
-7
BER.
Predicting performance based upon signal quality
varies with each loop. Generally, a noise margin of
0 dB or higher will support a bit error rate (BER) of
better than 10
-7
.
Type “Z” at the Current System Status screen in order
to reset performance registers to zero at both the
Current System Status and Performance History
screens.