


1-9
Making Measurements
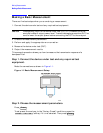
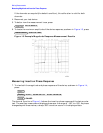
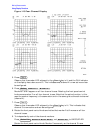
Measuring Magnitude and Insertion Phase Response
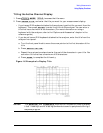
Figure 1-4 Example Insertion Phase Response Measurement
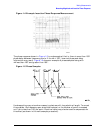
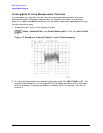
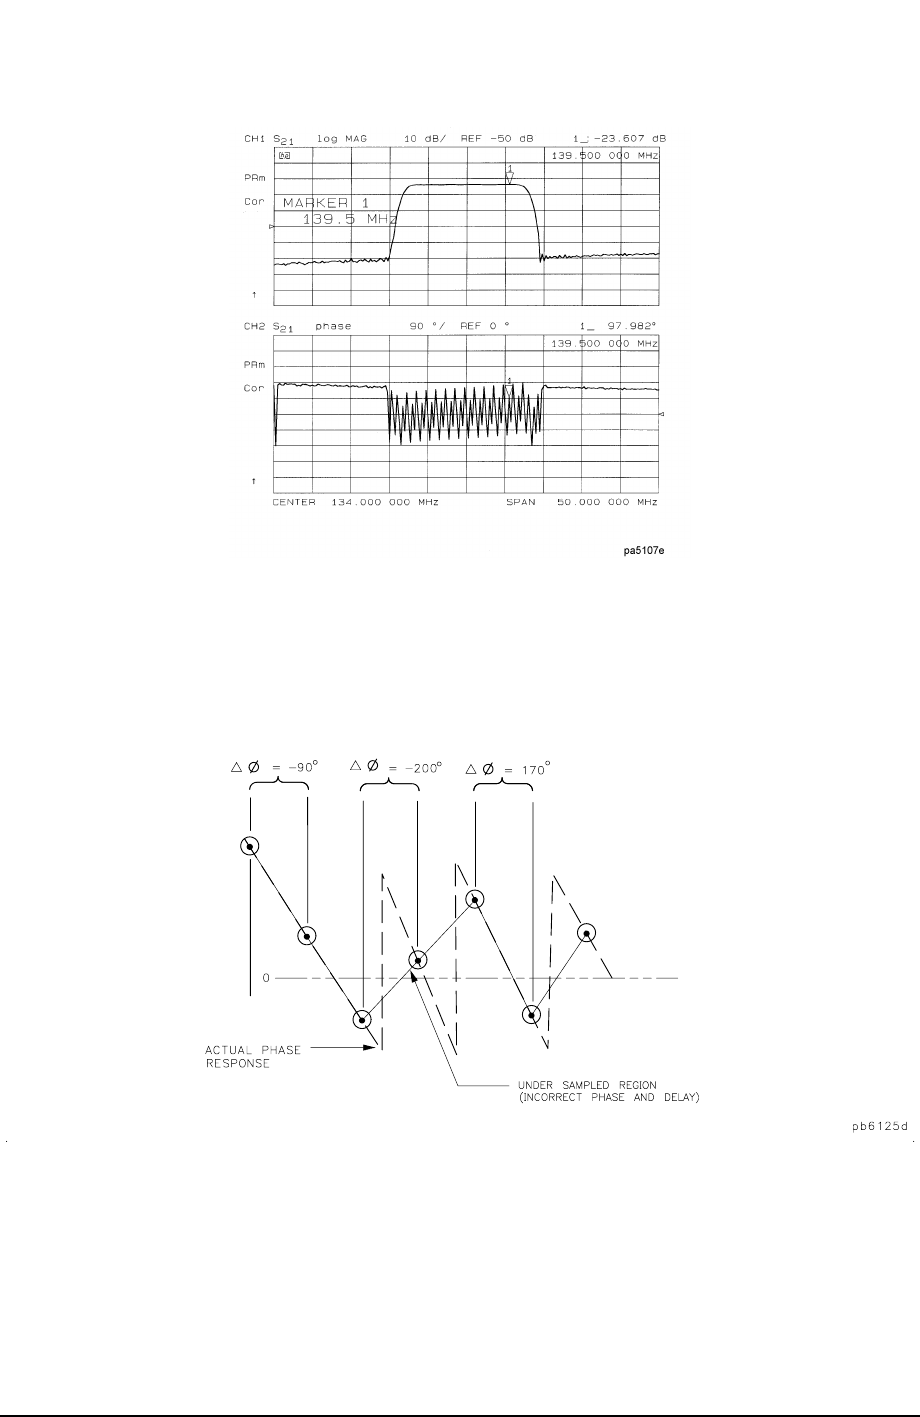
The phase response shown in Figure 1-5 is undersampled; that is, there is more than 180°
phase delay between frequency points. If the ∆Φ ≥ 180°, incorrect phase and delay
information may result. Figure 1-5 shows an example of phase samples being with
∆Φ less than 180° and greater than 180°.
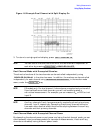
Figure 1-5 Phase Samples
Undersampling may arise when measuring devices with long electrical length. To correct
this problem, the frequency span should be reduced, or the number of points increased
until ∆Φ is less than 180° per point. Electrical delay may also be used to compensate for
this effect (as shown in the next example procedure).