15InRow RC/RD/RP (600 mm) User’s Guide
Summary Page
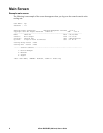
When you log on to the Web interface at the cooling unit, navigation tabs are displayed at the top of the
screen. Below the navigation tabs, a top menu bar lists options related to the selected tab. The status field
displays information about the selected tab or top menu bar option.
Navigation tabs
Five tabs are displayed at the top of the screen:
• Home—View any active alarm or warning conditions and clear active alarms; this tab is displayed
when you log on for the first time.
• Group—View and configure group settings.
• Unit—View cooling settings, unit properties, identification information, view or reset run hours,
and configure service intervals.
• Logs—View and configure the event and data logs, and configure Syslog settings.
• Administration—Configure security, network connection, notification, and device settings.
Quick status
The quick status tab is displayed in the upper right of every screen in the Web interface. The tab displays
a warning of any alarms.
Status
The Active Alarms field displays the states (No alarms present, Warning, or Critical) of both the cooling
group and individual cooling units. The Recent Device Events table displays the five most recent device
events, and the dates and times they took place. Click More Events at the bottom of the Recent Device
Events table to see the entire event log.
Help
Click Help, located in the upper right hand corner of the Web interface, to view context-sensitive
information.
Click the green “device operating normally” icon to return to the status screen where
the status of the cooling unit is displayed.
Click the “attention required” icon to return to the status screen where active
warnings and alarms are displayed.
Click the “alarm detected” icon to return to the status screen where active alarms are
displayed.


