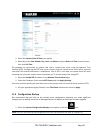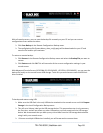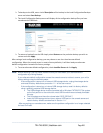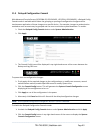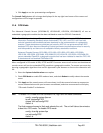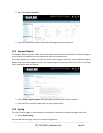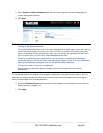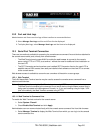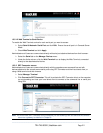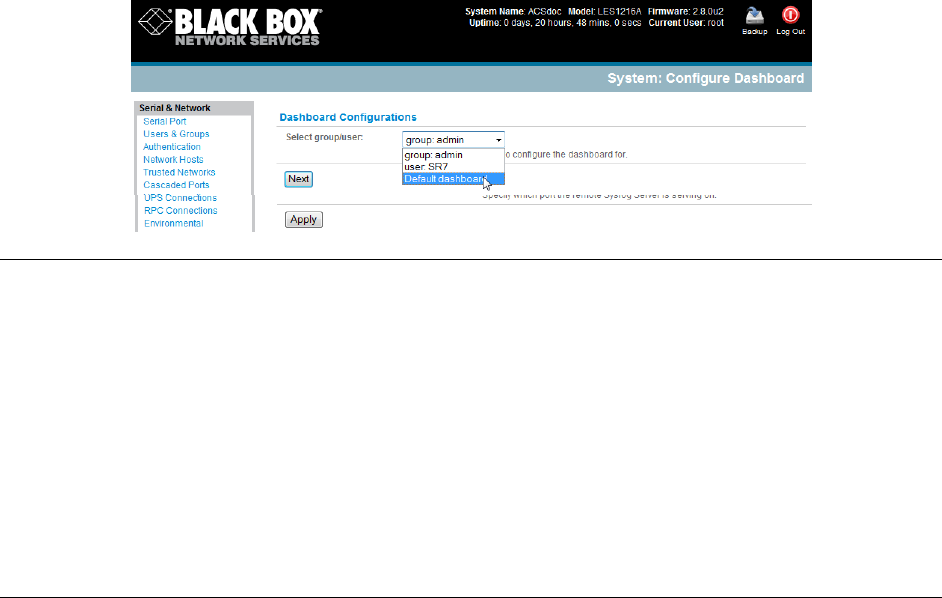
Select System: Configure Dashboard and select the user (or group) you are configuring this
custom dashboard layout for.
Click Next.
Note: You can configure a custom dashboard for any admin user or for the admin group or you can
reconfigure the default dashboard.
The Status:Dashboard screen is the first screen displayed when admin users (other than root) log
into the console manager. If you log in as “John,” and John is member of the admin group and
there is a dashboard layout configured for John, then you will see the dashboard for John upon
log-in and each time you click on the Status:Dashboard menu item.
If there is no dashboard layout configured for John, but there is an admin group dashboard
configured, then you will see the admin group dashboard instead. If there is no user dashboard or
admin group dashboard configured, then you will see the default dashboard.
The root user does not have its own dashboard.
Use the above configuration options to enable admin users to setup their own custom
dashboards.
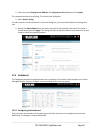
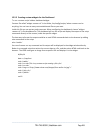
The Dashboard displays six widgets. These widgets include each of the Status screens (alerts, devices,
ports ups, rpc, and environmental status) and a custom script screen. The admin user can configure
which of these widget is to be displayed where:
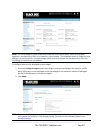
Go to the Dashboard layout panel and select which widget is to be displayed in each of the six
display locations (widget1 …6).
Click Apply.
_____________________________________________________________________
724-746-5500 | blackbox.com Page 206


