


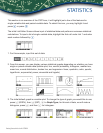


GRAPH
Various icon (Run, Table, Dynamic, Recursion & Conics) will allow you to graph or analyze the
graphs of given information. This section is an overview of the GRAPH Icon and will highlight
some basic features of this mode.
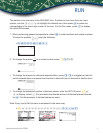
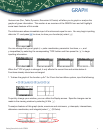
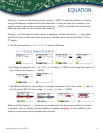
The initial screen allows immediate input of functions set equal to zero. You may begin inputting
data into Y1: and press l to store; to draw your function(s), select u.
You can change the type of graph (r = polar coordinates, parametric functions, x =, and
y-inequalities) by selecting the corresponding TYPE button and then press the $ to begin
inputting information.
When the TYPE of graph is changed, it only effects the current line and entries below it.
Functions already stored are unchanged.
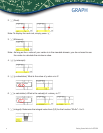
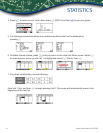
1. To draw the graph of the function y=2x
2 -
5x-3 from the Icon Menu system, input the following:
• 32fs-5f-3l
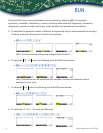
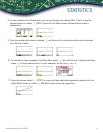
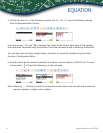
To quickly change your window, you can utilize the Replay arrows. Specic changes can be
made to the viewing window by selecting V-Win e.
To analyze features of this graph (roots, maximum and minimums, y-intercepts, intersections,
determine coordinates, and integrals) select y (G-Solve).
Getting Started with the fx-9750GII
5