


DS_Q48DR1R533_03152007
7
ELECTRICAL CHARACTERISTICS CURVES
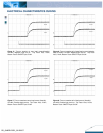
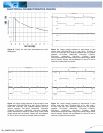
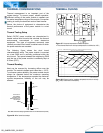
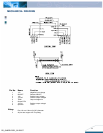
Figure 13: Output voltage response to step-change in load
current Iout2 (75%-50%-75% of Io, max; di/dt = 2.5A/µs) at
Iout1=7.5A. Load cap: 470µF, 35m
Ω
ESR solid electrolytic
capacitor and 1µF ceramic capacitor. Ch1=Vout2
(200mV/div), Ch2=Iout2 (7.5A/div), Ch3=Vout1 (200mV/div),
Ch4=Iout1 (7.5A/div) Scope measurement should be made
using a BNC cable (length shorter than 20 inches). Position
the load between 51 mm to 76 mm (2 inches to 3 inches)
from the module.
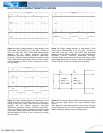
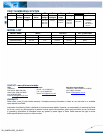
Figure 14: Output voltage response to step-change in load
current Iout1 (75%-50%-75% of Io, max; di/dt = 2.5A/µs) at
Iout2=7.5A. Load cap: 470µF, 35m
Ω
ESR solid electrolytic
capacitor and 1µF ceramic capacitor. Ch1=Vout2 (200mV/div),
Ch2=Iout2 (7.5A/div), Ch3=Vout1 (200mV/div), Ch4=Iout1
(7.5A/div) Scope measurement should be made using a BNC
cable (length shorter than 20 inches). Position the load between
51 mm to 76 mm (2 inches to 3 inches) from the module.
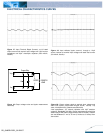
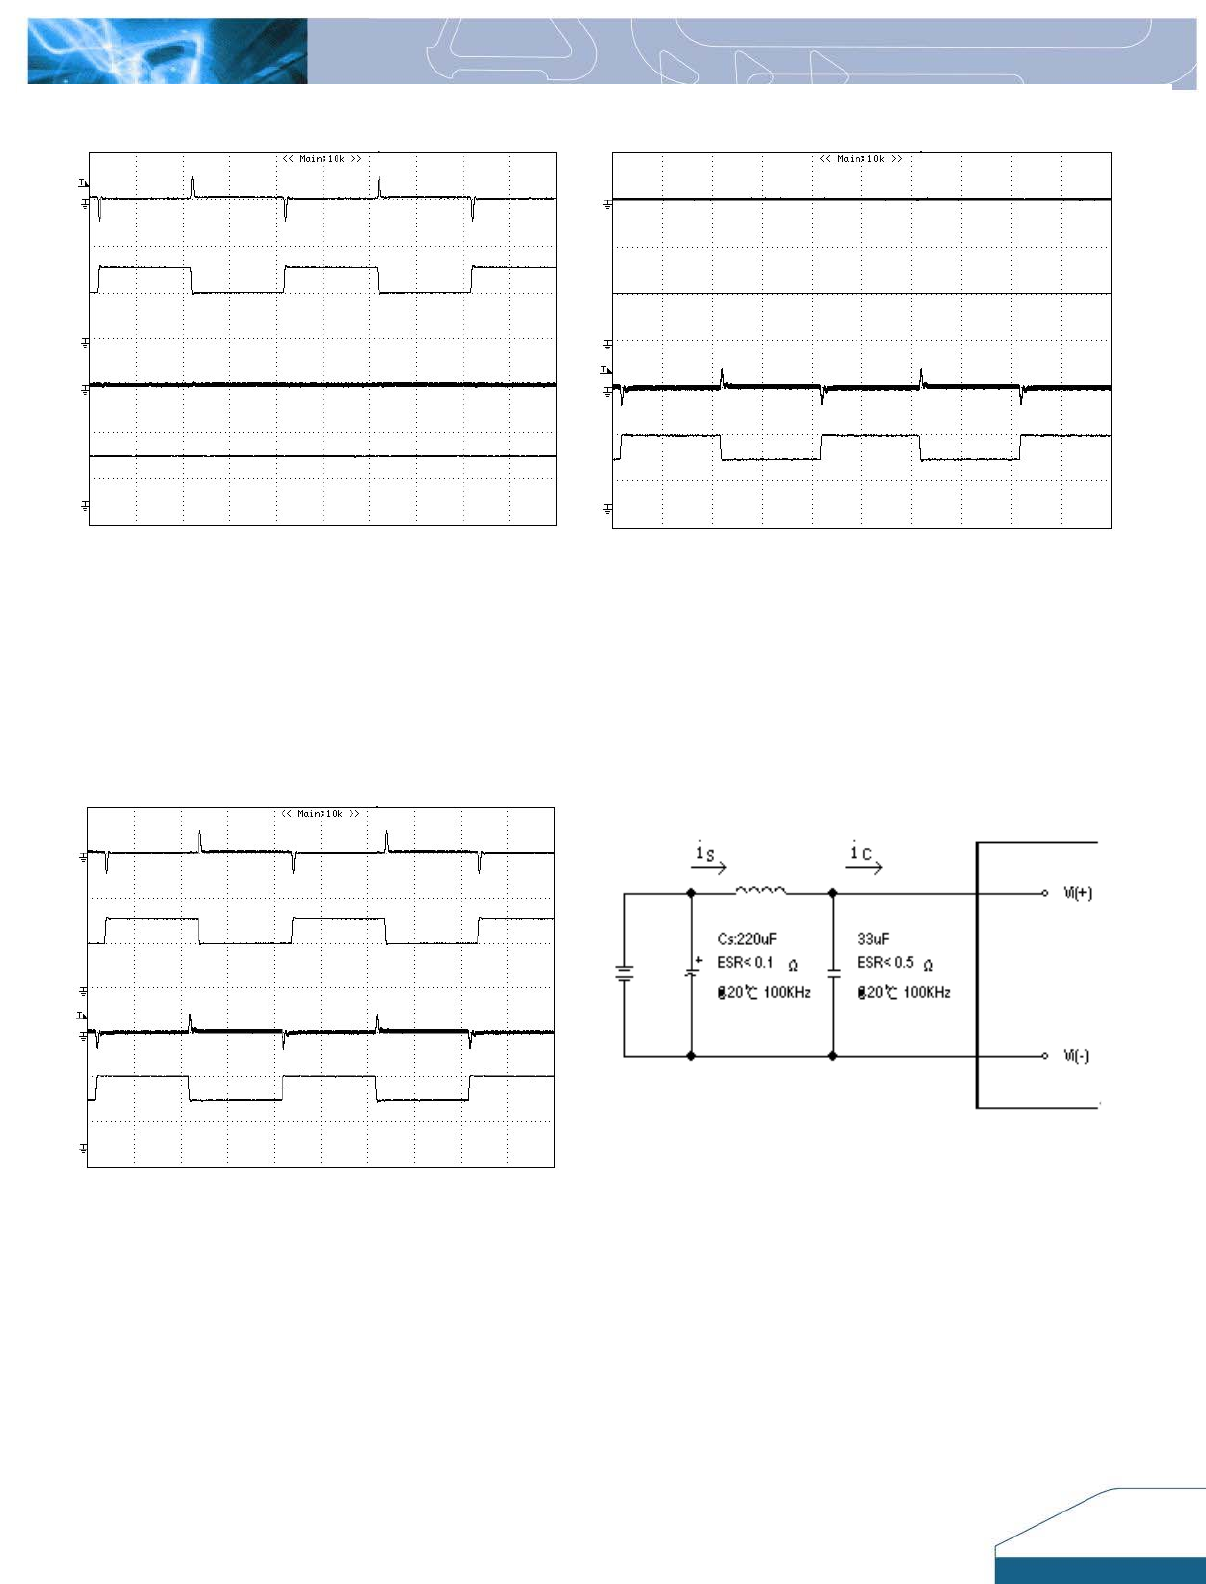
Figure 15: Output voltage response to step-change in load
current Iout2 and Iout1 (75%-50%-75% of Io, max; di/dt =
2.5A/µs). Load cap: 470µF, 35m
Ω
ESR solid electrolytic
capacitor and 1µF ceramic capacitor. Ch1=Vout2
(200mV/div), Ch2=Iout2 (7.5A/div), Ch3=Vout1 (200mV/div),
Ch4=Iout1 (7.5A/div) Scope measurement should be made
using a BNC cable (length shorter than 20 inches). Position
the load between 51 mm to 76 mm (2 inches to 3 inches)
from the module.
Figure 16: Test set-up diagram showing measurement points for
Input Terminal Ripple Current and In
p
ut Reflected Ripple
Current.
Note: Measured input reflected-ripple current with a simulated
source Inductance (L
TEST
)
of 12 µH. Capacitor Cs offset possible
battery impedance. Measure current as shown above
Ch4
Ch3
Ch2
Ch1
Ch4
Ch3
Ch2
Ch1
Ch4
Ch3
Ch2
Ch1