


INSTRUCTION FOR WINDOWS SYSTEMS
11
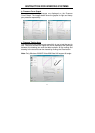
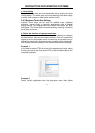
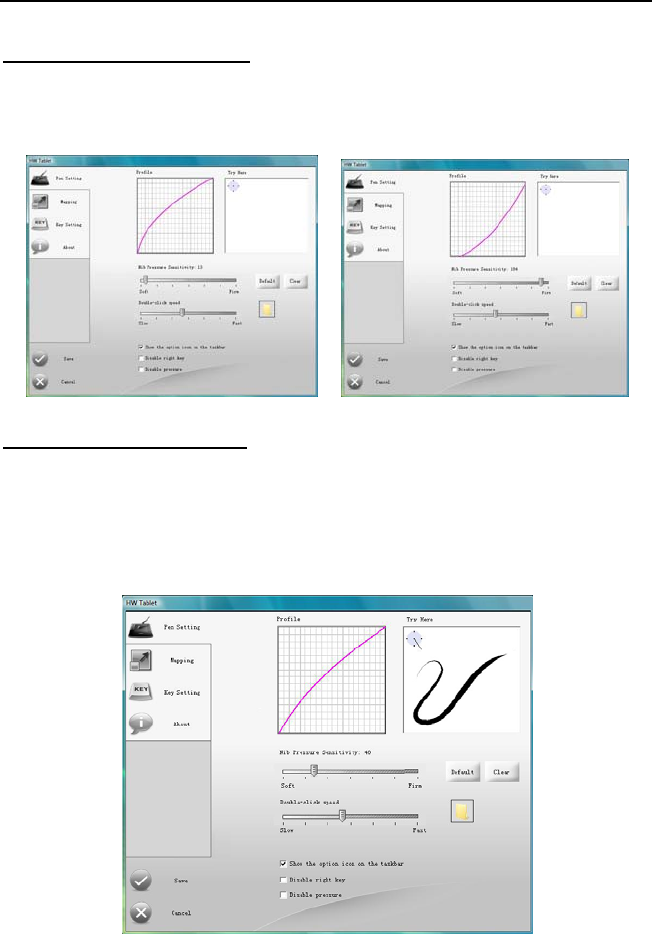
b. Pressure Curve Graph
Pen pressure sensitivity changes are displayed on the Pressure
Curve Graph. The images below show the graphs for light and heavy
pen pressure respectively.
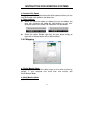
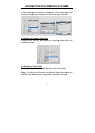
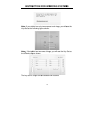
c. Pressure Testing Area
The right area is the pressure test area which is use to test the pen tip
feel. The round circle at the upper left corner represents the tile angle
between the drawing pen and the tablet surface. All the writing and
drawing in the test area can be cleared by clicking the Clear button.
Note: Only Windows 2000/XP/Vista X86/Vista X64 support tilt angle.