Software stack
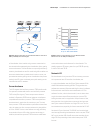
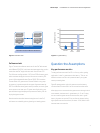
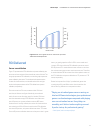
Figure 7 shows the software stack used in the PoC. We started
with VMware ESX 3.5U1, which was the latest production version
at the time the PoC began. We also used Virtual Center 2.5.*
The VMs were configured with 1 vCPU and 2 GB of memory each,
which emulates the physical server infrastructure used by ESL.
In each VM we loaded Windows Server 2003* 32-bit and the
Counter-Strike 1.6* game server. Counter-Strike is a very popu-
lar game and a good example of the types of games hosted by
ESL. Each VM hosts three game server processes, and each game
server process can host up to 12 game users. Again, this corre-
sponds with the typical deployment processes used by ESL for
its physical game servers.
Now that we’ve described the technologies used in the PoC,
we’ll move on to detailing the engineering and testing phase.
Question the Assumptions
Key performance metrics
The key performance metric for ESL—or for any online gaming
application—is the “in-game transaction latency.” This can be
defined as the sum of round-trip network latency and game
server processing time.
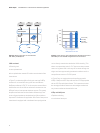
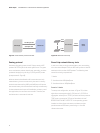
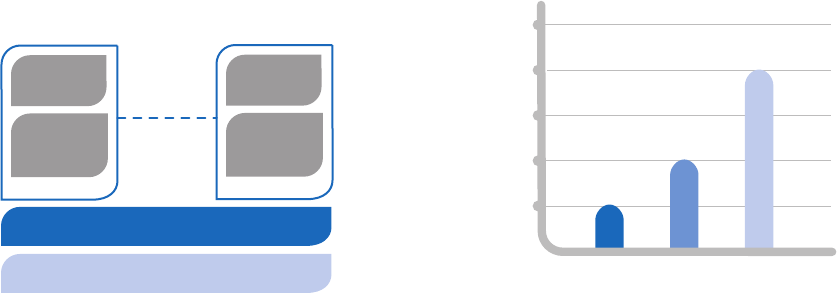
Figure 8 represents the typical in-game transaction latency
numbers that ESL observed in its current native environment.
When players are connected to the game servers through a local
area network, the best case in-game latency is ~5 ms. For play-
ers connected to game servers via the Internet, the in-game
latency is greater or equal to 20 ms; and for the players having
high-speed Internet connections, it’s about ~10ms, which is the
Internet best-case scenario.
Counter-
Strike 1.6*
Windows
Server 2003*
32 bit
Intel® Xeon® Processor 7400 Series-based Server
VMware ESX 3.5 U1*
VM1
Counter-
Strike 1.6*
Windows
Server 2003*
32 bit
VMn
Figure 7. Software stack.
25
20
15
10
5
Average latency (rms)
Typical
Internet
Best
Internet
Best LAN
Figure 8. In-game latency.
7
White Paper Consolidation of a Performance-Sensitive Application


