No Lookaside With Lookaside
0%
100%
200%
300%
400%
500%
600%
700%
800%
900%
1000%
Operations Sorted by Slowdown
Slowdown
0%
100%
200%
300%
400%
500%
600%
700%
800%
900%
1000%
Operations Sorted by Slowdown
Slowdown
(a) 100 Mb/s
0%
100%
200%
300%
400%
500%
600%
700%
800%
900%
1000%
Operations Sorted by Slowdown
Slowdown
0%
100%
200%
300%
400%
500%
600%
700%
800%
900%
1000%
Operations Sorted by Slowdown
Slowdown
(b) 10 Mb/s
0%
100%
200%
300%
400%
500%
600%
700%
800%
900%
1000%
Operations Sorted by Slowdown
Slowdown
0%
100%
200%
300%
400%
500%
600%
700%
800%
900%
1000%
Operations Sorted by Slowdown
Slowdown
(c) 1 Mb/s
0%
100%
200%
300%
400%
500%
600%
700%
800%
900%
1000%
Operations Sorted by Slowdown
Slowdown
0%
100%
200%
300%
400%
500%
600%
700%
800%
900%
1000%
Operations Sorted by Slowdown
Slowdown
(d) 100 Kb/s
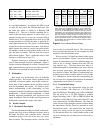
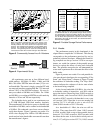
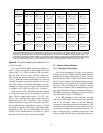
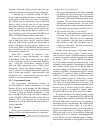
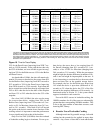
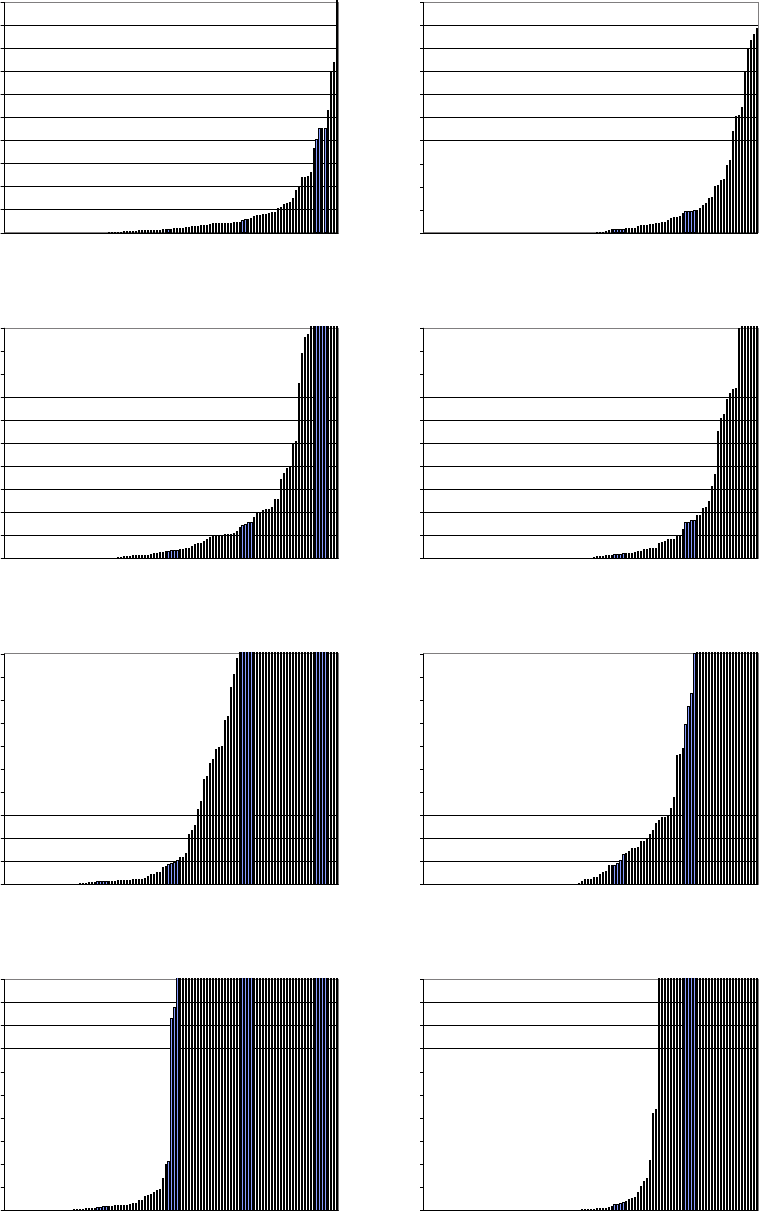
These figures compares the distribution of slowdown for the operations of the CDA benchmark without lookaside caching to their
slowdowns with lookaside caching to a DVD.
Figure 12. Impact of Lookaside Caching on Slowdown of CDA Benchmark Operations
12


