


75 Appendix F
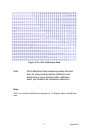
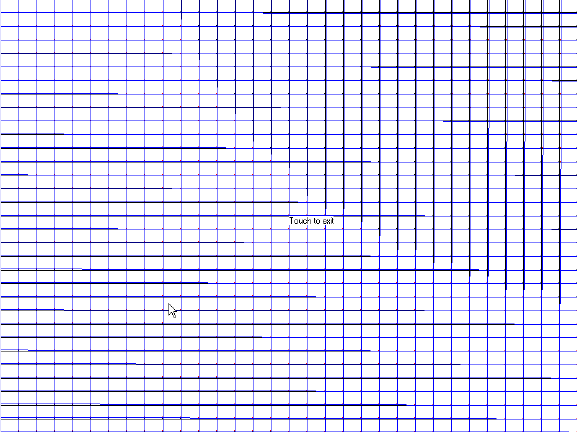
Figure F.13: Plot Calibration Data
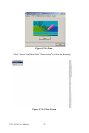
Draw
This is to test the touch screen operation. Its display shows touch loca-
tion.
Note Plot Calibration Data enabled provides the blue
lines to show linearity before calibration and
black lines to show linearity after calibration
when you finished the advanced calibration.