


The History Tab
67
The History Tab
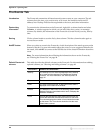
Introduction The History tab graphs network and intrusion activity on your system.
Note: For detailed information about activity on the Events graph, click the graph near
the marker that shows the time you are interested in. The Events tab appears, with the
intrusion closest to that time highlighted.
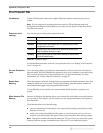
History tab options This table describes the options available on the History tab:
Information on the
History tab
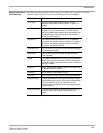
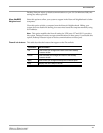
This table describes the features on the History tab that provide information about
intrusions:
This option... Has this effect...
Interval Selects the interval for displaying activity on both graphs, as follows:
• Min displays activity over the last 90 minutes.
• Hour displays activity over the last 90 hours.
• Day displays activity over the last 90 days.
Table 17: History tab options
This feature... Has this effect...
Interval Selects the interval for displaying activity on both graphs, as follows:
• Min displays activity over the last 90 minutes.
• Hour displays activity over the last 90 hours.
• Day displays activity over the last 90 days.
Total in 90 Hours
(Days, Minutes)
Displays summary statistics for the selected interval, as follows:
• Critical displays the number of events rated critical. This event type
is tracked with a red line on the Events graph.
• Suspicious displays the number of events rated serious and
suspicious. These event types are tracked with a yellow line on the
Events graph.
• Traffic displays the amount of network traffic, measured in number
of packets. Traffic is tracked with a green line on the Network Traffic
graph.
Events Graph Displays the number of critical and suspicious events detected per
second during the specified period. The maximum number of events
per second appears in the upper left corner of the Events graph.
Network Traffic
Graph
Tracks the number of packets your system sends and receives during
the period shown. The maximum number of events per second appears
in the upper left corner of the Events graph.
Table 18: History tab information features