OPERATION
EATON Powerware
®
Energy Management System (EMS) Upgrade Kit User’s Guide S 164201724 Rev 1 www.powerware.com
40
Menu Map
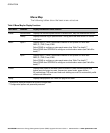
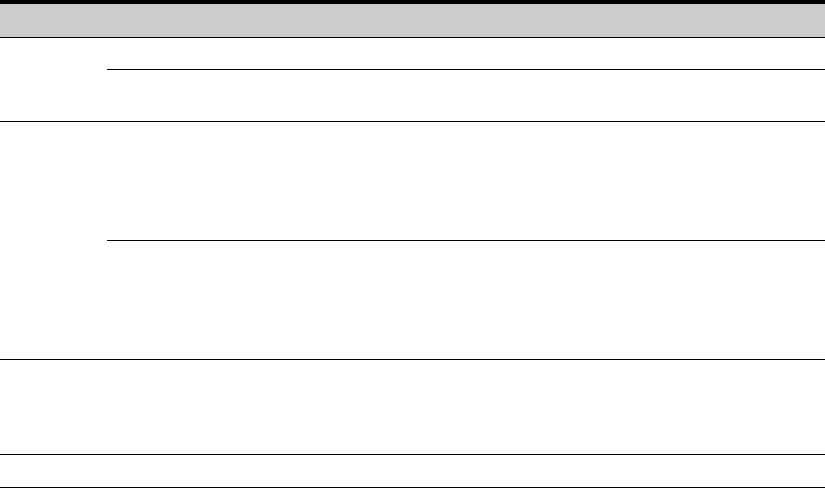
The following tables show the basic menu structure.
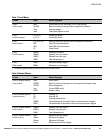
Table 6. Menu Map for Display Functions
Main Menu Submenu Display Information or Menu Function
Events
Active Events Displays list of active system events. As events clear, they are removed from the list.
History Displays historical log of system events. The log stores the most recent 127 events
and alarms.
Meter*
Input 2 Displays Input 2 / Panel 2 performance meters for the system or critical load:
RMS / % / THD / Crest / KWH
Select PANEL to configure or view panel meters (see Table 7 for detail).**
Select PANEL then SCHEDULE to configure or view breaker meters (see Table 8 for
detail).**
Input 1 Displays Input 1 / Panel 1 performance meters for the system or critical load:
RMS / % / THD / Crest / KWH
Select PANEL to configure or view panel meters (see Table 7 for detail).**
Select PANEL then SCHEDULE to configure or view breaker meters (see Table 8 for
detail).**
Profile* Displays load profile for the most recent 24 months. Profile includes highest and
lowest input and output currents, frequencies, power levels, power factors,
AC undervoltage, THD, and exact time each reading occurred. Current month’s profile
reflects real−time values.
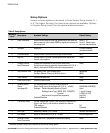
Setup* Displays setup options. See Table 9 on page 42 for detail.
* Information displayed depends on product configuration.
** Configuration options are password−protected.


