30
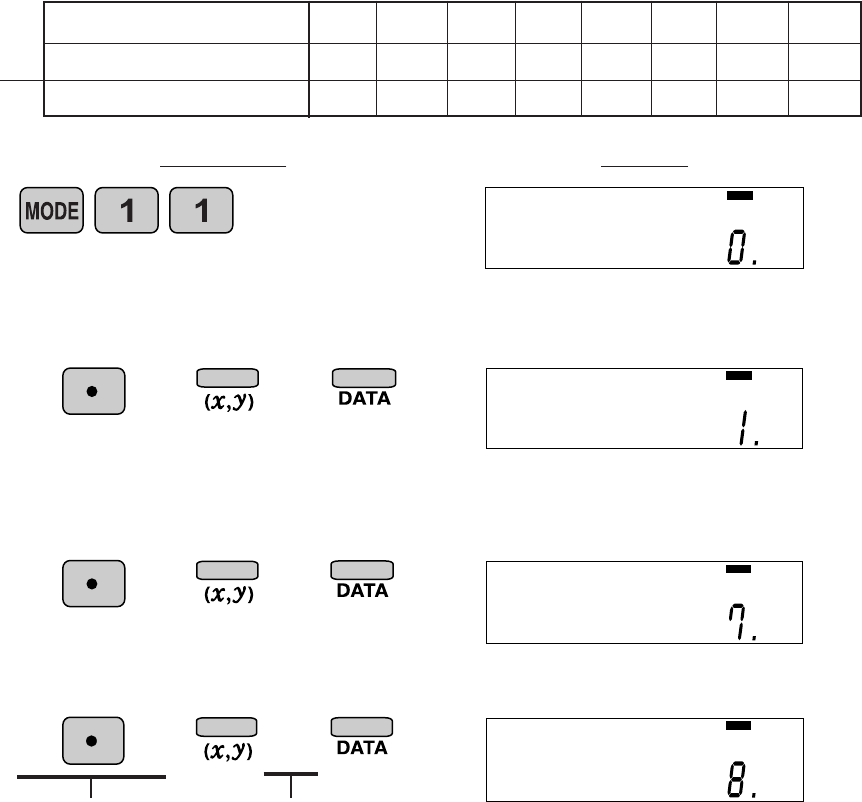
The table below summarizes the dates in April when cherry
blossoms bloom, and the average temperature for March in
that same area. Determine basic statistical quantities for
data X and data Y based on the data table.
<Example 3>
6 2 13
D ata table 3
Select dual-variable statistics mode and linear regression calculation in sub-mode.
Year 1983 1984 1985 1986 1987 1988 1989 1990
A ver age tem per ature
6.2 7.0 6.8 8.7 7.9 6.5 6.1 8.2
D ate blossom s bloom
13911 5712 157
x
y
DEG
STAT
DEG
STAT
DateTemperature
6 15
8 2 7
DEG
STAT
.
.
.
.
.
.
DEG
STAT
O per ation D isplay
Stat 1
DATA SET=
DATA SET=
DATA SET=
1


