


SLUU130A – September 2002 – Revised February 2003
12
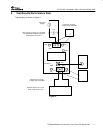
TPS40003-Based 5-A Converter in Less Than One Square Inch
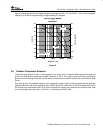
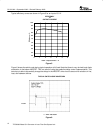
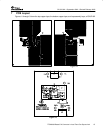
Typical efficiency curves are shown in Figure 5 for an input of 3.3 V.
Efficiency – %
EFFICIENCY
vs
OUTPUT CURRENT
I
OUT
– Output Current – A
0123456
50
55
60
65
70
75
80
85
90
95
100
Figure 5.
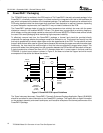
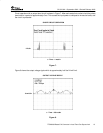
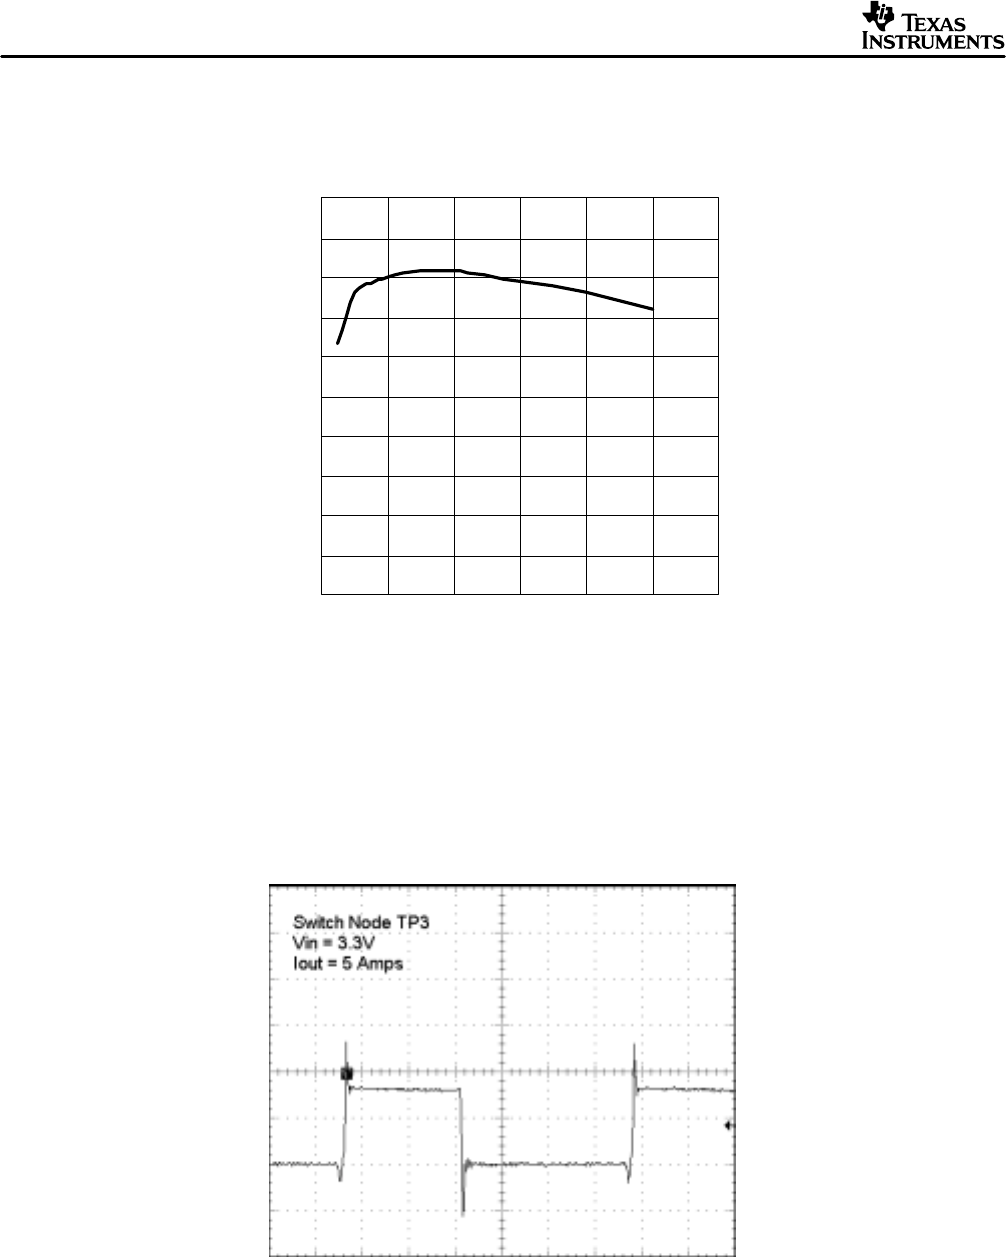
Figure 6 shows the switch node during typical operation at full load. Note that there is very minimal body diode
conduction in the bottom MOSFET. This is a result of using the predictive delay control implementation. This
technique is able to dynamically change the delays in the MOSFET drive circuit to account for variations in line,
load, and between devices.
t – Time – 250 ns/div
2 V/div
TYPICAL SWITCH NODE WAVEFORM
Figure 6.