


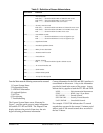

6 Section 61245201L1-5, Issue 3 61245201L1-5C
A measure of signal quality for each HDSL loop is displayed
in graphic form on the bottom right and left of the screen.
The measure is from 0 (poor signal quality) to 9 (excellent
signal quality). Guidelines for interpreting the indicators are:
0 Noise margin is ≤ 0 dB (≈ 10
-7
BER)
1-8 Margin measurement above 10
-7
BER in dB
9 Margin is ≥ 9 dB (excellent quality) above 10
-7
BER
Predicting performance based upon signal quality varies
with each loop. Generally, a noise margin of 0 or higher
will support a bit error rate of better than 10
-7
.
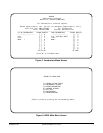
The Performance History screen is illustrated in Figure 8.
At each 15-minute interval, the performance information
is transferred to the 15-minute performance data registers
accessed from the Performance History screen. At each
24-hour interval, the performance data is transferred into
the 24-hour performance data register also accessed
using this screen.
At the Current System Status screen, type “Z” in order to
reset performance registers to zero at both the Current
System Status and Performance History screens.
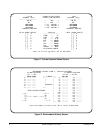
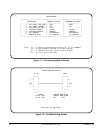
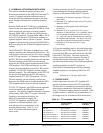
Figure 9 depicts the FT1 Loopback Options screen
while Figure 10 depicts the Self-Test Options screen.
Loopbacks and Self-Test may be evoked or terminated
using these screens. A status of current loopback
conditions is also provided.
Figure 11 shows the Provisioning Options screen.
Provisioning may only be viewed from the FNID at all
times. Provisioning is controlled from the FT1 DP.
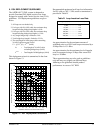
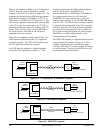
The Troubleshooting Display, shown in Figure 12,
graphically presents an FT1 circuit. The unit reviews
red, yellow, and blue alarm conditions in the circuit to
automatically predict where a fault is located. Once a
fault location is suspected, the corresponding portion
of the circuit on the screen is highlighted and a
message describing the failure will appear.