


Page 7 of 16
Monitor Tool
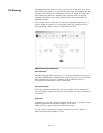
Viewing Messages
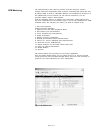
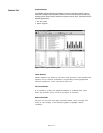
The main traffic overview display shows (chronologically) every message
captured for each signaling link. This overview display shows one line of
essential information for each message. The type and format of information is
displayed in columns and is controlled by the user. Each message can be
decoded further to show a one line description per octet/field. Figure 4
shows a typical traffic overview.
Time Stamping
Each captured message is given a timestamp. The timestamp reference is the
instrument’s internal clock.
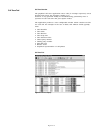
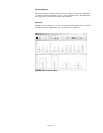
Alarm View
If a physical layer alarm occurs (e.g., AIS), a pop-up alarm view window
appears showing software LEDs for all bearers. This view can be expanded to
show individual alarm conditions.
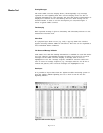
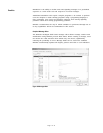
Link Status and Message Validation
Link status view and link loading information is available for each link under
test. The software can highlight message-encoding errors found in received
messages. In the traffic overview display, a message with an error is
highlighted in red. The ‘‘message sequence validation’’ function advises the
user of errors in message sequences (e.g., messages which do not fit into a
normal call pattern). The erroneous messages are highlighted in red.
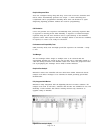
Data Import
It is possible to import data from the Agilent acceSS7 monitoring system or
from the Agilent 37900D signaling test set or from a text file into the
Signaling Advisor.
Figure 5: Traffic overview display.